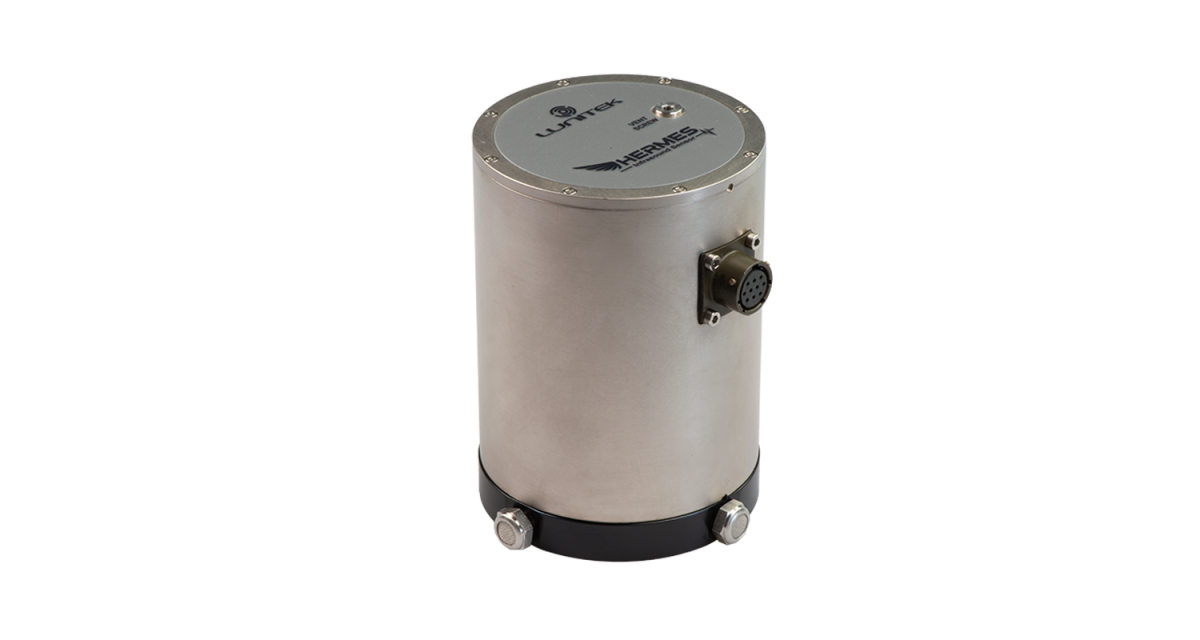
LUNITEK is proud to present and offer you our HERMES, a premium-quality INFRASOUND SENSOR to detect low-frequency (not audible) sound waves produced by natural phenomena such as volcanic eruptions, adverse weather conditions, lightning, asteroids, wave motion, outgassing and minor volcanic explosions, debris-flow, rapid mass flows such as snow avalanches and landslides, earthquakes and related ground shaking, sea storms, mountain waves.
The rugged casing together with the low power consumption guarantee the employment of HERMES sensors also in hostile environment.
•BROADBAND (0.033* HZ to 200 HZ) *lower frequencies on request
•HIGH DYNAMIC RANGE (110 dB) LOW NOISE (-62DB PA² /HZ, REL TO 1 PA AT 1 HZ)
•LOW POWER
•LOW COST
•ROBUST PHYSICAL BUILD QUALITY AND SEALED ELECTRONICS
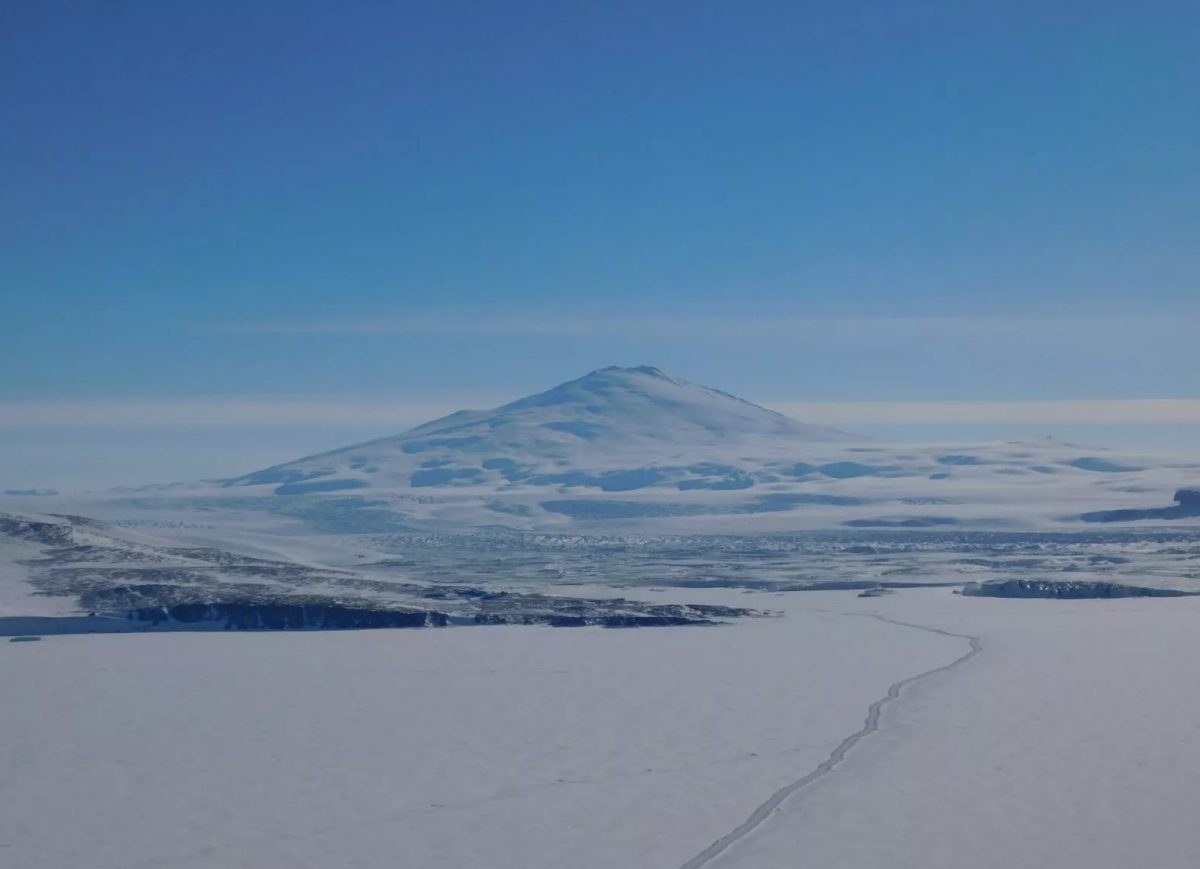
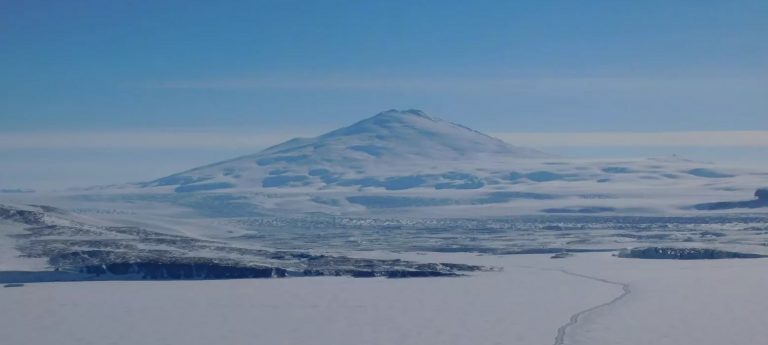
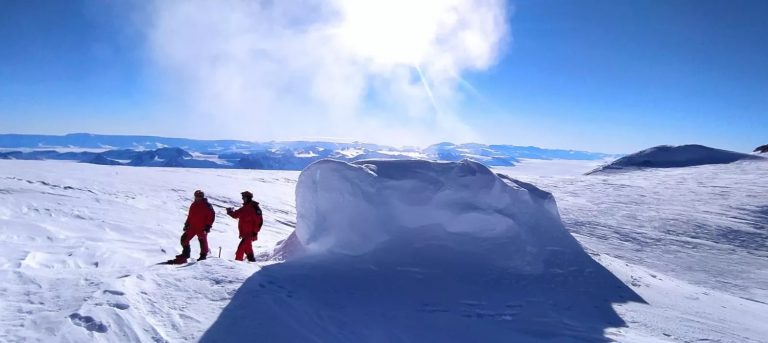
2.732 meters high and almost completely covered by ice, the Melbourne Volcano is a dormant stratovolcano: its last eruption occurred about 100 years ago and it is therefore considered an active volcano. Its summit is characterized by a 1 km wide crater covered with snow and ice and surrounded by numerous parasitic vents.
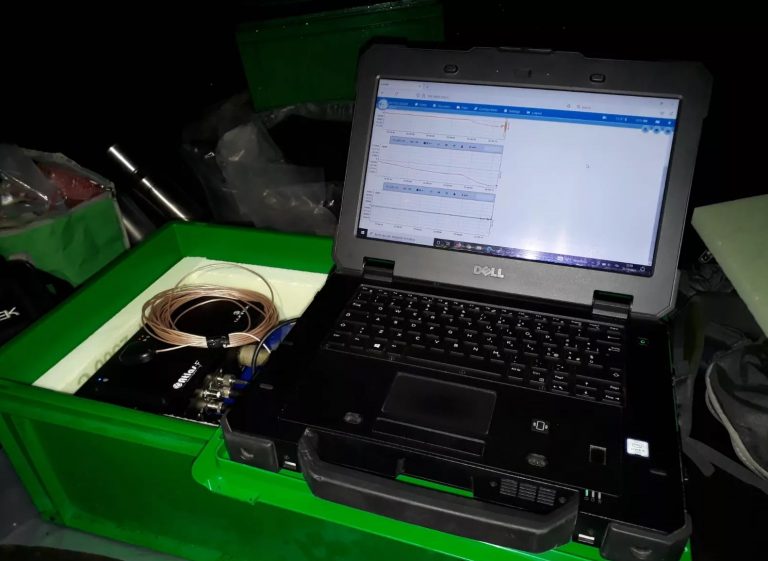
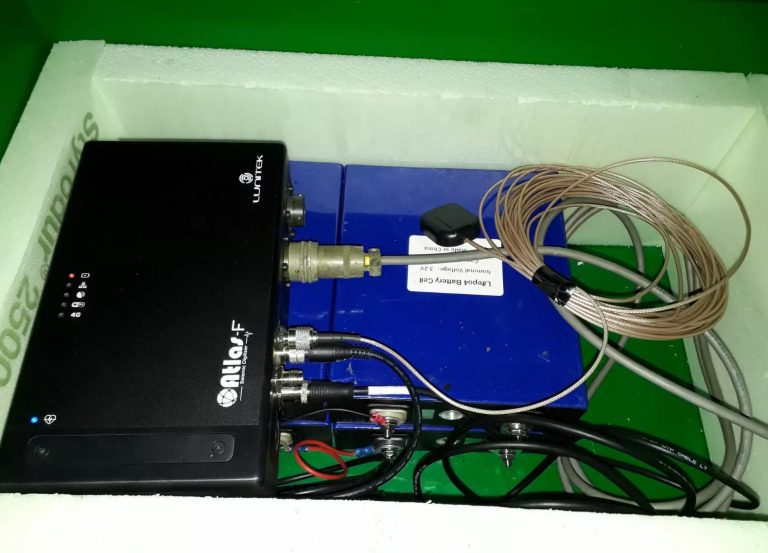
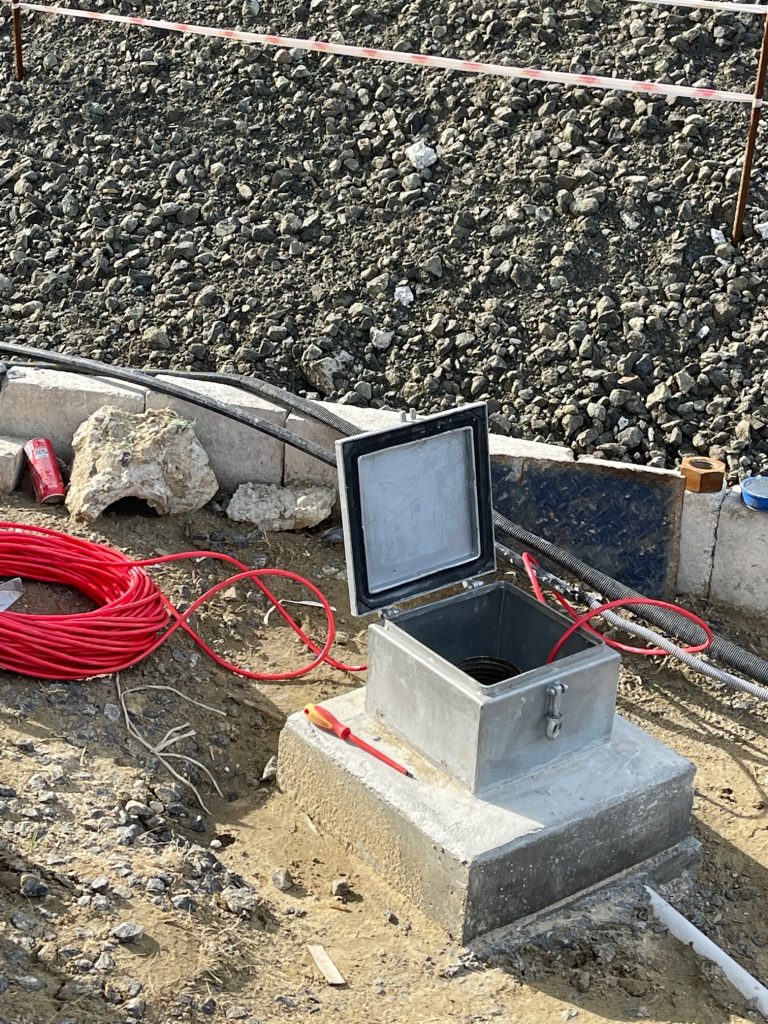
Lunitek supplied the equipment to the Catania INGV office for a month-long measurement and testing campaign in the Antarctic. The installation was carried out near the Melbourne volcano, using a battery pack appropriately sized for the duration of the tests.
The instrument firmware was configured in low-power mode, deactivating all processes not required for the application. In addition to being recorded in the instrument’s memory, data was acquired in real time using a narrowband radio link between the installation site and the base camp several kilometers away.
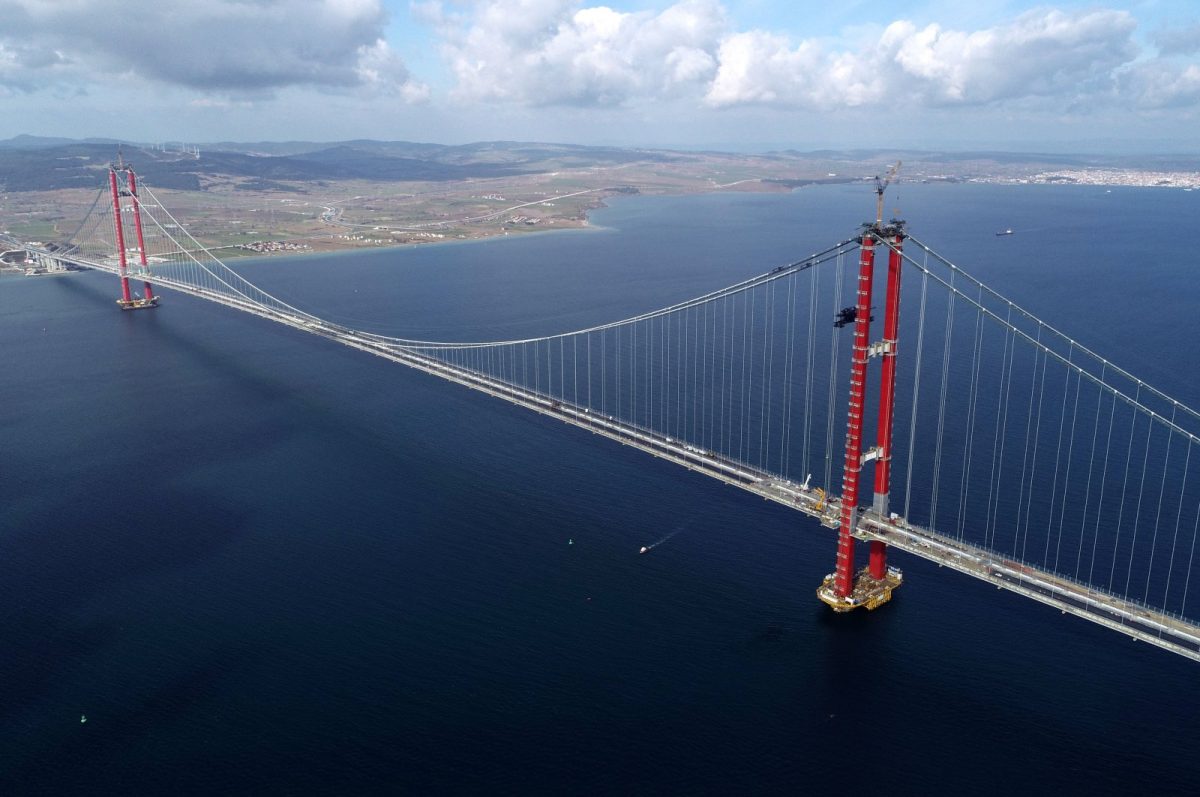
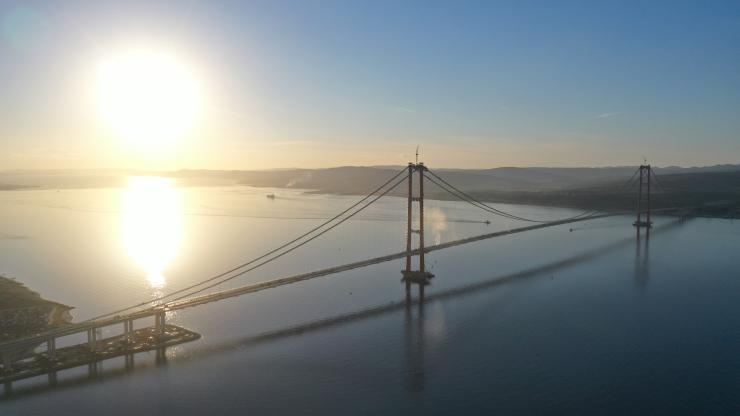
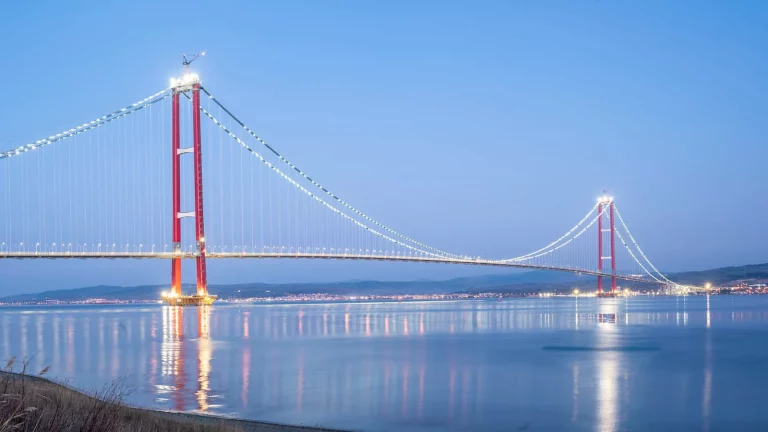
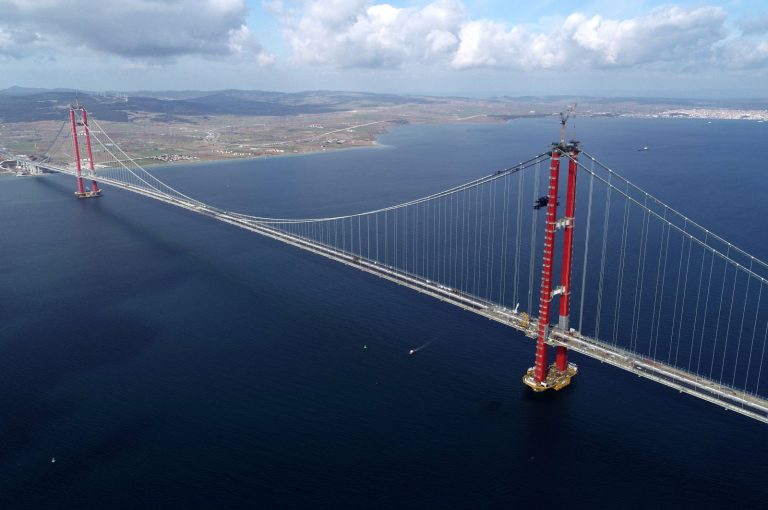
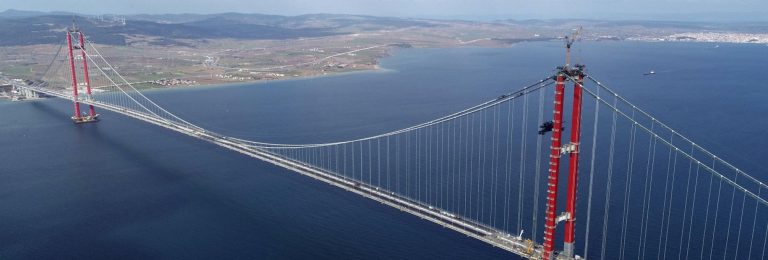
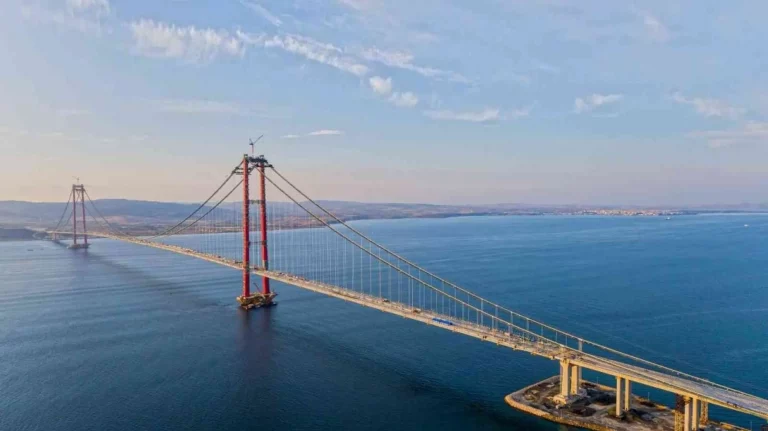
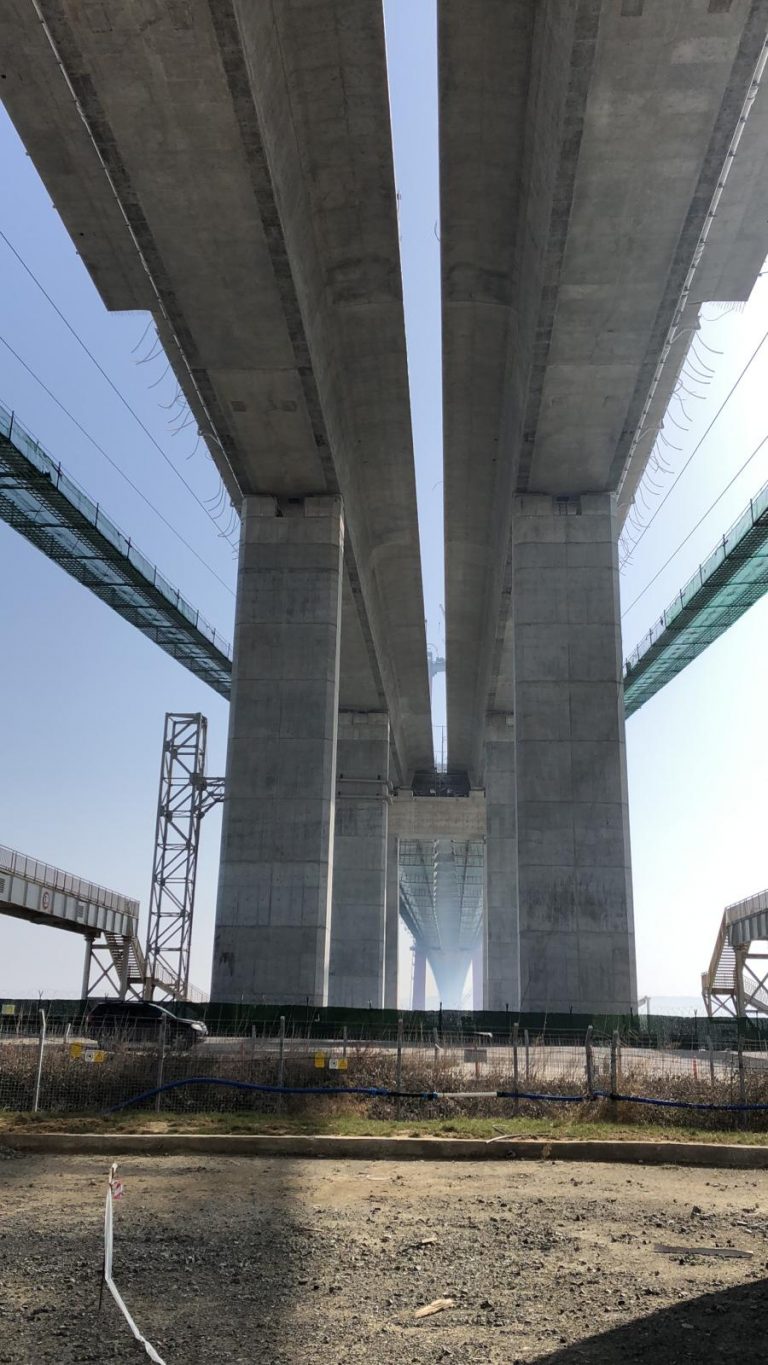
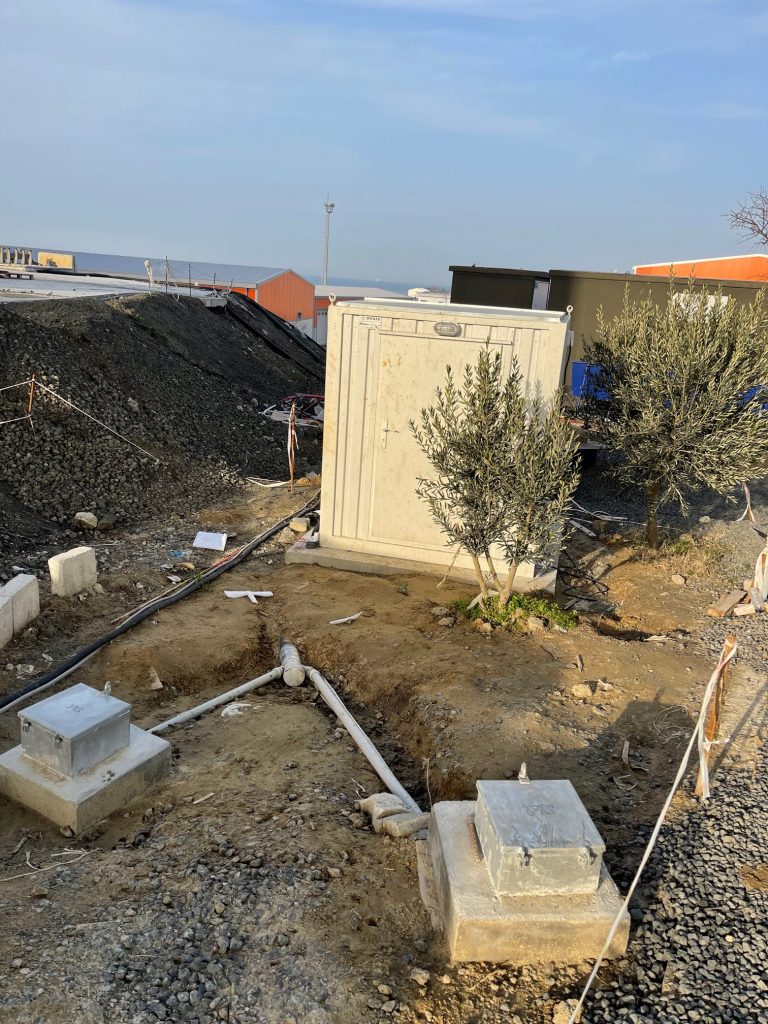
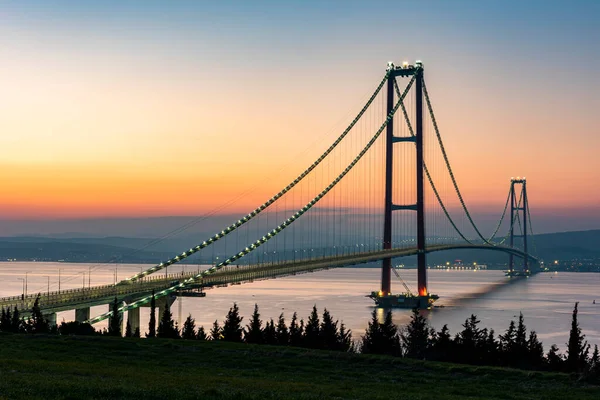
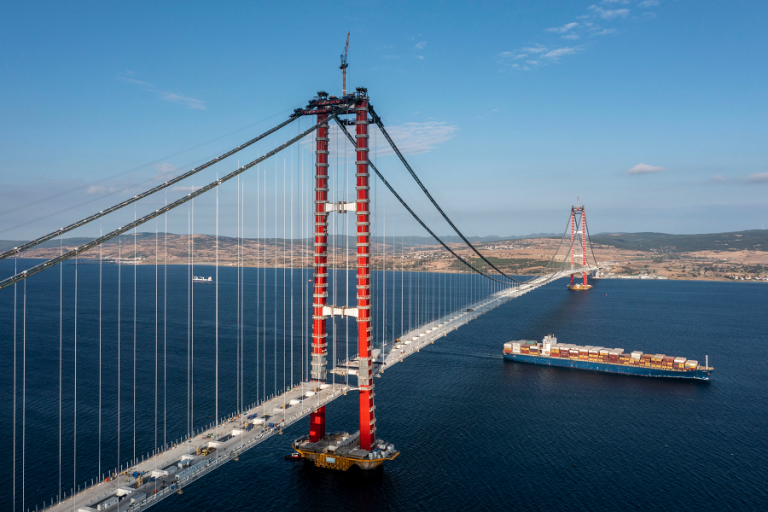
The 1915 Çanakkale Bridge will become the world’s longest midspan suspension bridge with a 2,023-meter (6,637-feet) span between its towers, which are painted red and white to reflect the colors of the Turkish flag. The spires will tower 318 meters (1,043 feet) high and the total length of the bridge will reach 4,608 meters (15,118 feet).
In the construction of the longest bridge in the world, engineering had to overcome the challenge of effective earthquake protection in areas of high seismicity.
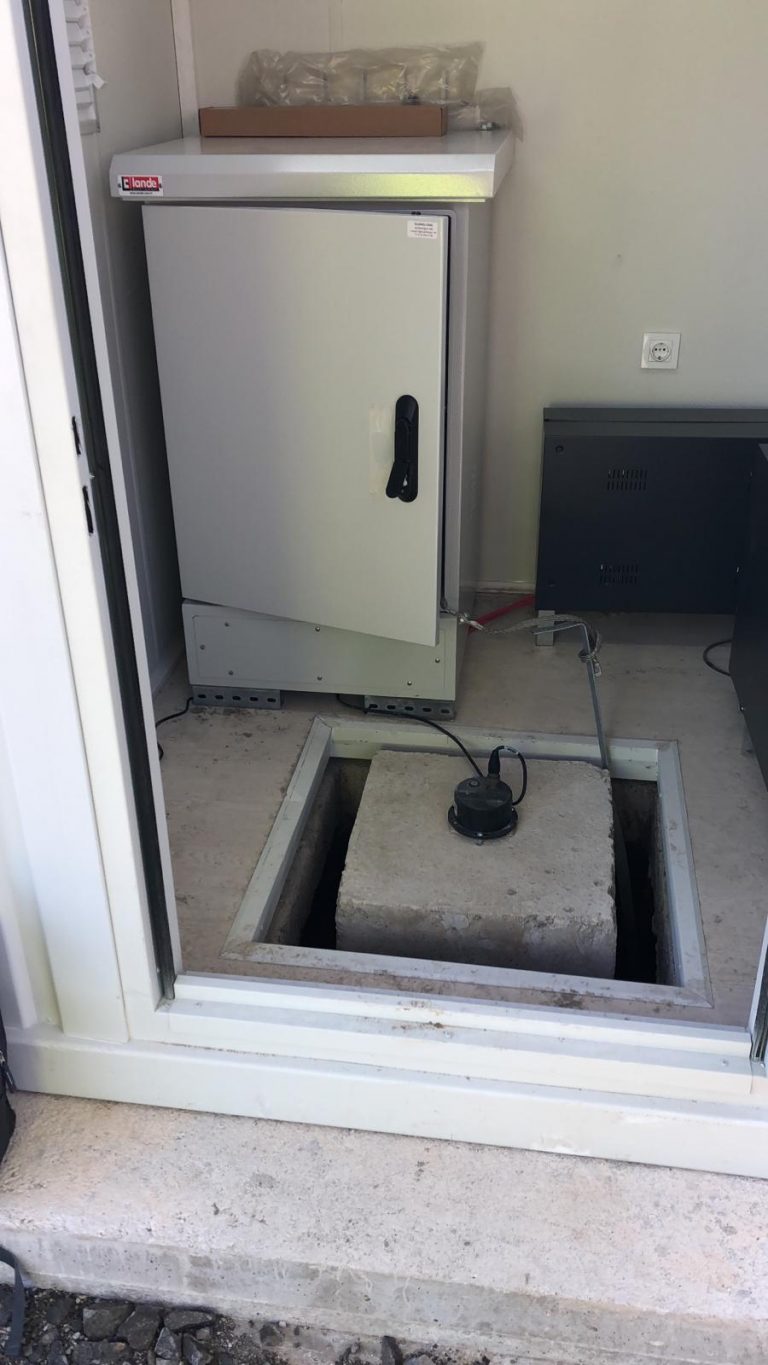
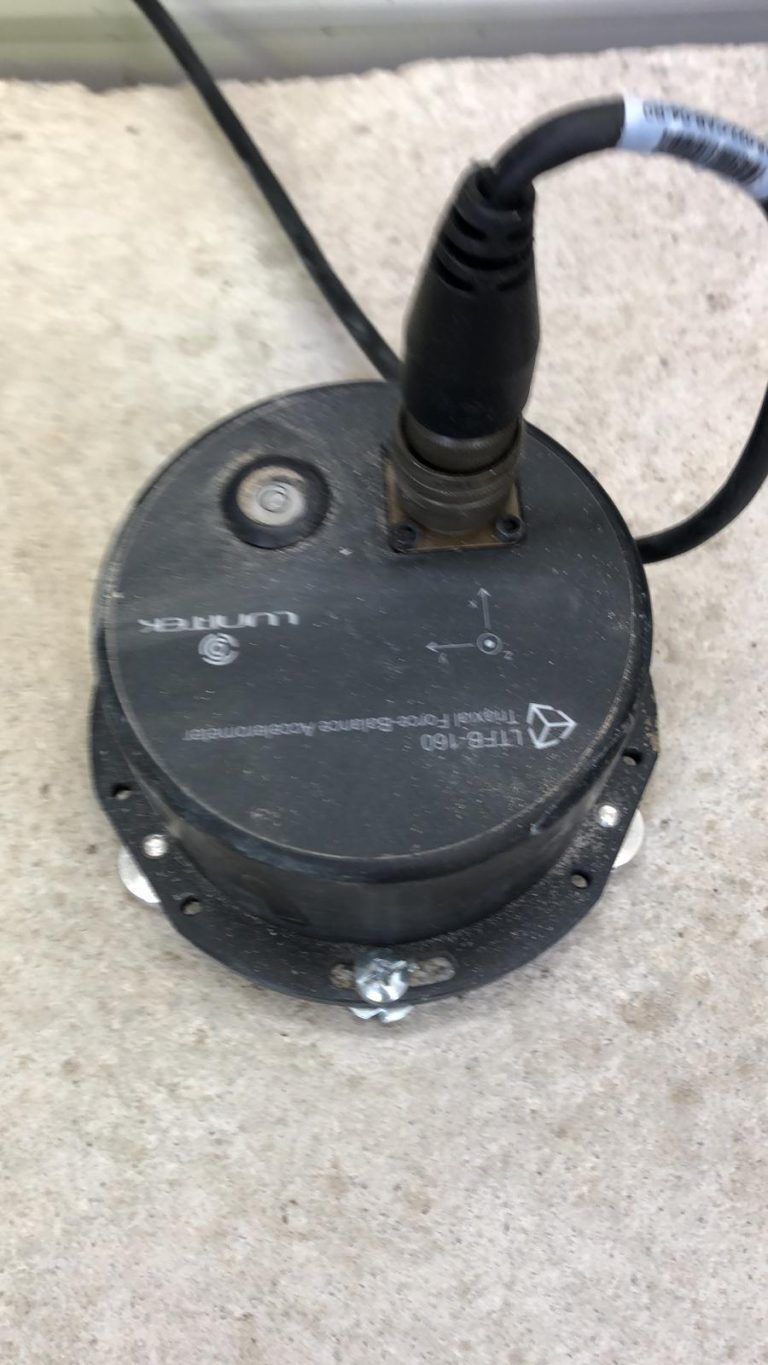
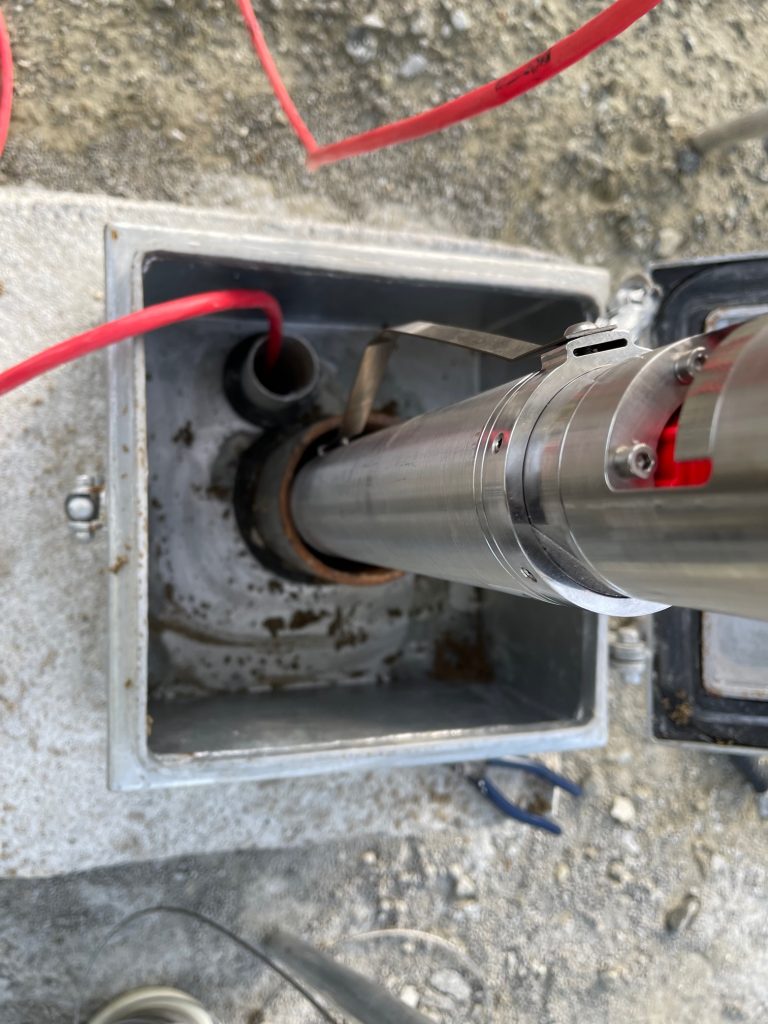
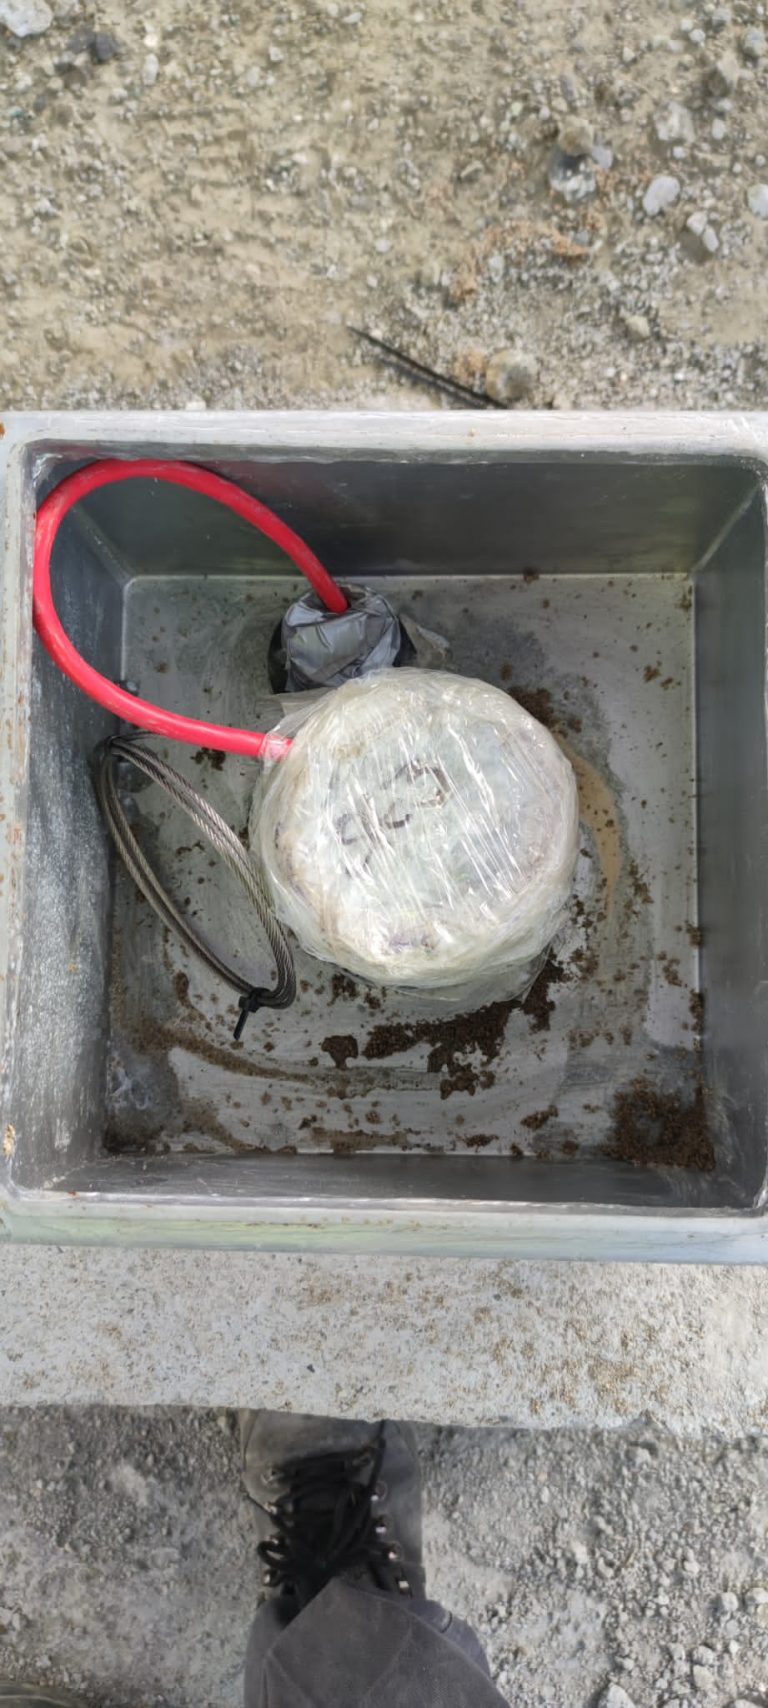
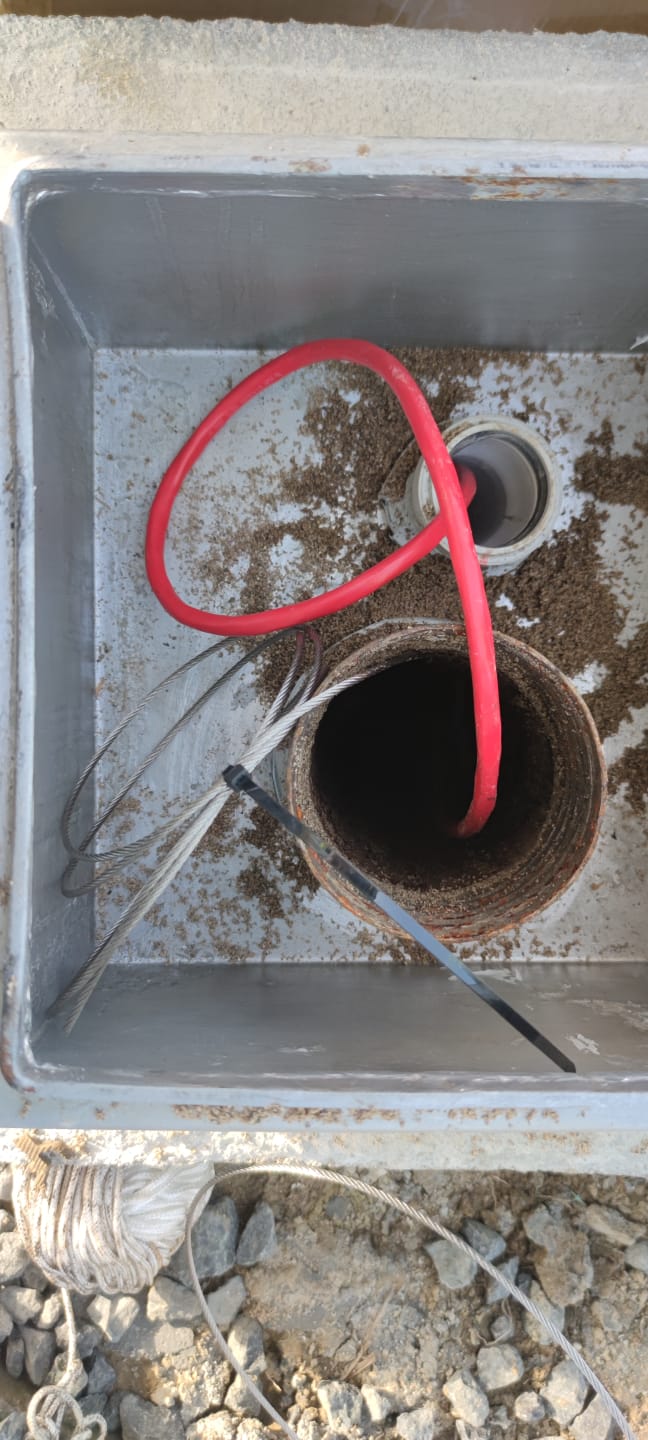
In order to monitor the area Lunitek provided LTFB-160-4G accelerometers and boreholes seismometers.
LTFB-160-4G BOREHOLE SEISMOMETER
LTFB-160 BH
provides excellent long term stability, reliable measurements and is
ideally suited to challenging sites where measurements can be improved
by using borehole installation.
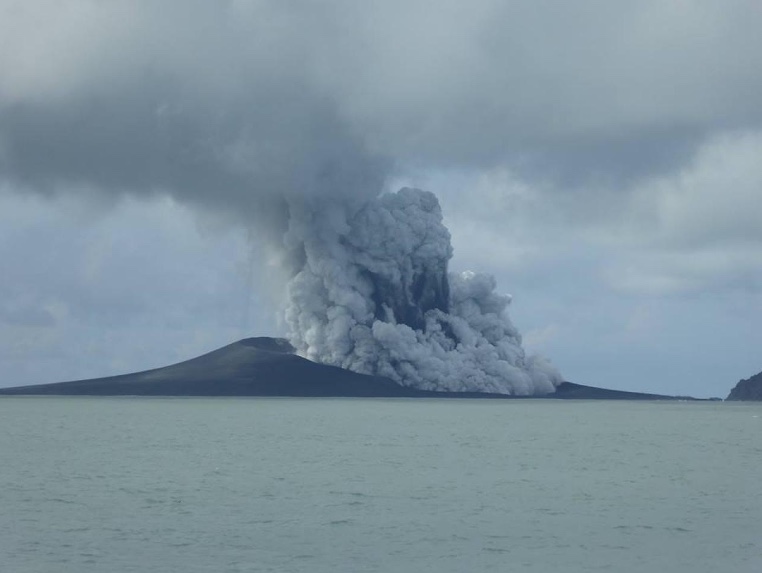
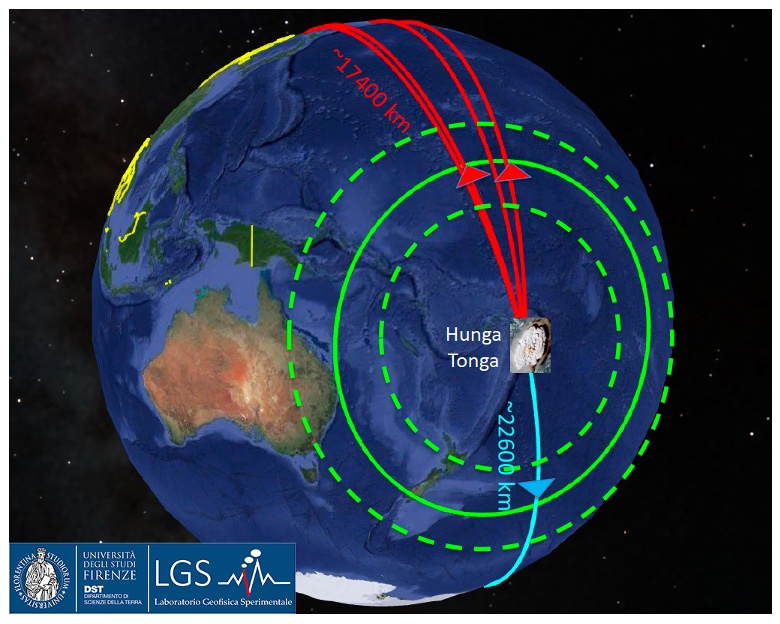
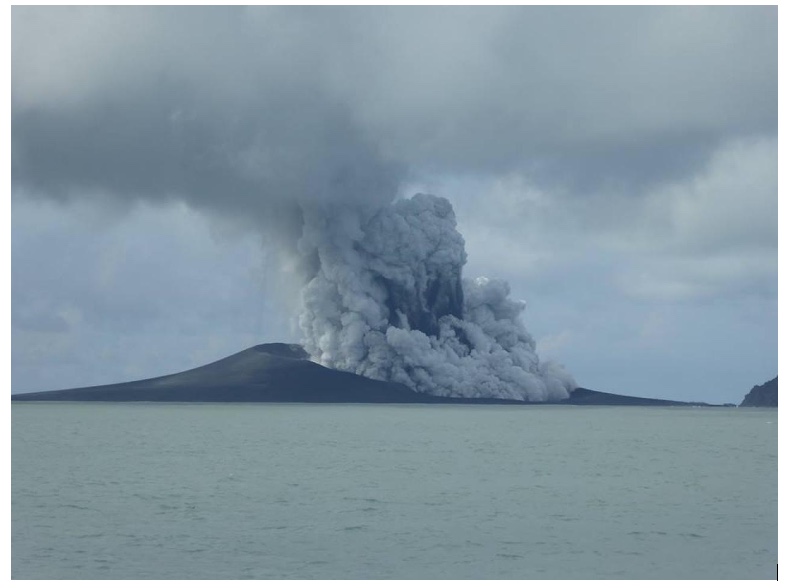
The eruption of the submarine volcano Hunga-Tonga-Ha’apai took place on Sunday January, 15th 2022 at 17:15 local time (5:15 in Italy) in the South Pacific archipelago and was one of the most powerful recorded in decades in the area. The Hunga Tonga – Hunga Ha’apai volcano is located in the Pacific Ocean in the Kingdom of Tonga about 65 km from the island where the capital Tonga is located and about 450 km from Fiji. It is a chain of islands located northeast of New Zealand, an area geologically set above a subduction zone of the Pacific plate below the Australian one. Nasa claimed that the force of the eruption was 500 times stronger than that of the atomic bomb dropped by the United States on Hiroshima, Japan, at the end of World War II.
Tsunami waves unleashed by the eruption up to more than 10.000 km away reached the coasts of several countries bordering the Pacific, from the United States to Japan, Chile, Peru and Ecuador.
The volcano produced an eruption with a gigantic explosion, generating a cloud that extended over 30 km in height (stratosphere) and a shock wave that propagated across the planet, travelling thousands of kilometers in spherical propagation (green lines in Figure 1 and link)
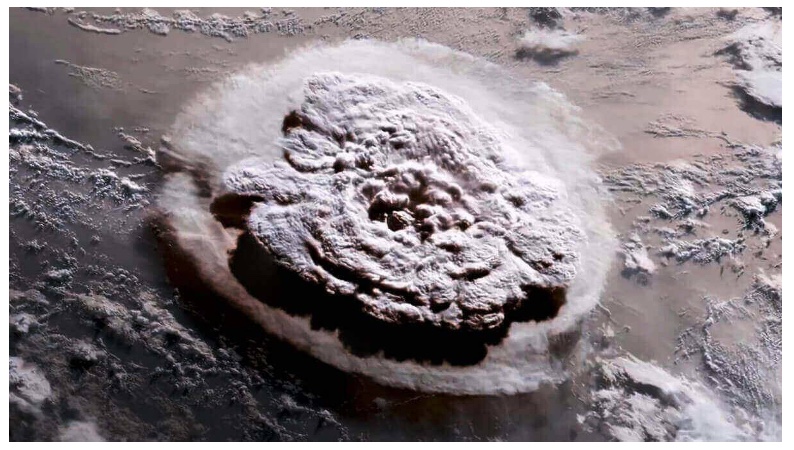
The phenomenon was observed by some geostationary satellites, whose sequential images show not only the enormous column of smoke produced, but also the displacement of dust and gas pushed by the shock wave.
The extraordinary power of the volcanic eruption was immortalized by satellites and also the shock wave that, travelling at the speed of sound, travelled the entire globe. Numerous barometers reports from all over the world captured its passage, with a sudden rise followed by an equally sudden fall in pressure.
The explosion was so powerful that it was recorded in detection instruments around the world.
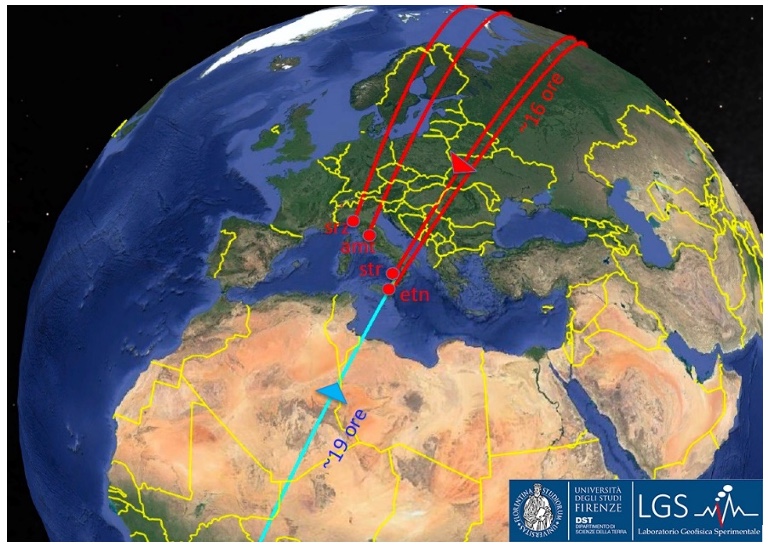
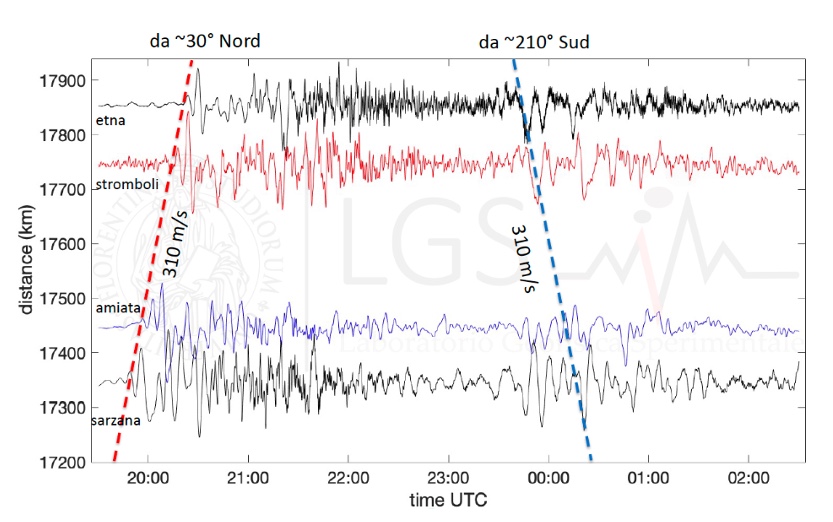
Laboratorio di Geofisica Sperimentale) of the Department of Earth Sciences of the University of Florence, as well as an infrasonic sensor of Lunitek, located in Sarzana, from 20:15 local time on January, 15th, began to record the shock waves produced by the volcano’s explosion (at a distance between 17300 and 17900 km from the eruption) with an average direction of origin of about 30°N (red lines in Figures 2 and 3). These first waves passed north of Russia near the Arctic Circle and have a very long period of about 5 minutes, at the limit of the physical properties of acoustic waves (blue lines in Figures 1 and 2).
figura 2
The waves were recorded about 19 hours after the eruption (blue line in Figures 1 and 2). They traveled in an opposite direction, covering a greater distance, about 22.600, and passing from the south to the Antarctic, with a direction of origin 210 ° S.
The difference in arrival times made it possible to calculate that both wave fronts propagated with a speed of about 310 m/s (about 1100 km/h), which is the apparent speed of sound propagation in the upper atmosphere (Figure 3).
figura 3
Lunitek Hermes infrasonic sensor
Infrasounds are low-frequency sound waves that are below the hearing threshold (20 Hz), little perturbations of atmospheric pressure which, due to the low atmospheric absorption of these low frequencies, can propagate for thousands of kilometers and be detected by pressure sensors..
The differential infrasonic sensor Hermes is based on differential pressure measurement and the use of an acoustic filter to eliminate the stationary component of atmospheric pressure. Pressure measurement is entrusted to industrial-grade electronic sensors, which combine high precision with high reliability and constant performance over time.
In addition to strong eruptions such as that of the Hunga-Tonga-Ha’apai submarine volcano on January, 15th 2022, there are many sources of infrasonic waves, most of them produced by natural phenomena such as non-linear interactions between open ocean waves (microbaroms, which generate a signal at ~0.16 Hz recorded across the earth’s surface at any time), adverse weather conditions, outgassing and minor volcanic explosions, rapid mass flows such as avalanches and landslides, earthquakes and associated ground shaking, storms, mountain waves. Effective anthropogenic sources of infrasound, on the other hand, are aircrafts, trains and disturbances generated by powerful explosions.
A range of sensors with different sensitivity, dynamics and frequency ranges are being industrialized by Lunitek, which are able to cover the amplitude and frequency ranges of most of the above mentioned infrasonic sources, thus enabling their effective monitoring.
The study of the infrasonic spectrum is often carried out using array techniques to improve the signal-to- noise ratio and locate sources. In such techniques, signals recorded by sensors placed at a known distance are compared and processed and it is essential that the amplitude and phase response of the sensors be the same. Particular care was taken in the design of the Lunitek sensor in order to have products with identical characteristics and therefore immediately usable in arrays.
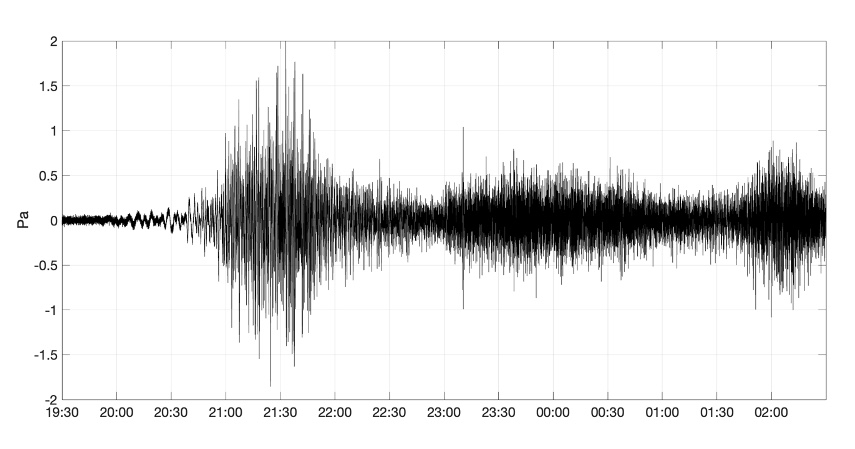
Below is shown the infrasonic signal produced by the eruption of the Hunga-Tonga-Ha’apai volcano and recorded in the Sarzana laboratories by the Lunitek Hermes 50 with high sensititvity (0.8V/Pa) and medium frequency range (0.03 – 200 Hz).
Bibliografia:
GECO S.r.l. , gennaio 2020, “Progetto di industrializzazione di Sensore Infrasonico”, LGS – Laboratorio Geofisica Sperimentale, 19 gennaio 2022, “L’eruzione del vulcano Hunga Tonga Ha’apai del 15 gennaio 2022 – aggiornamento con prima analisi dei dati”
L’eruzione del vulcano sottomarino Hunga-Tonga-Ha’apai è avvenuta Domenica 15 gennaio 2022 alle 17:15 ora locale (le 5:15 in Italia) nell’arcipelago del Sud del Pacifico ed è stata una delle più potenti registrate da decenni nell’area.
Il vulcano Hunga Tonga – Hunga Ha’apai è ubicato nell’Oceano Pacifico nel Regno di Tonga a circa 65 Km dall’isola dove si trova la capitale Tonga e a circa 450 km dalle isole Fiji. Si tratta di una catena di isole ubicate a nord-est della Nuova Zelanda, un’area geologicamente impostata sopra una zona di subduzione della placca pacifica sotto quella australiana. La Nasa ha affermato che la forza dell’eruzione è stata 500 volte più forte a quella della bomba atomica sganciata dagli Stati Uniti su Hiroshima, in Giappone, alla fine della seconda guerra mondiale.
Le onde di tsunami scatenate dall’eruzione fino a oltre 10.000 km di distanza, hanno raggiunto le coste di diversi Paesi che affacciano nel Pacifico, dagli Stati Uniti al Giappone, al Cile, Perù ed Ecuador.
Il vulcano ha prodotto un’eruzione con una gigantesca esplosione generando una nube che si è estesa oltre i 30 km di altezza (stratosfera) e un’onda d’urto (Shock Wave) che si è propagata per tutto il pianeta viaggiando per migliaia di chilometri mantenendo una propagazione di tipo sferico (linee verdi nella figura 1)
Il fenomeno è stato osservato da alcuni satelliti geostazionari, le cui immagini in sequenza mostrano non solo l’enorme colonna di fumo prodotta, ma anche lo spostamento di polveri e gas spinte dall’onda d’urto.
La straordinaria potenza dell’eruzione vulcanica è stata immortalata dai satelliti e con essa anche l’onda d’urto che, viaggiando alla velocità del suono, ha percorso l’intero globo. Numerose sono le segnalazioni dei barometri da ogni parte del mondo che hanno catturato il suo passaggio, con un repentino rialzo seguito da un altrettanto calo di pressione.
L’esplosione è stata talmente potente da essere stata registrata negli strumenti di rilevazione di tutto il mondo.
Dopo circa 16 ore di viaggio ed oltre 17mila chilometri percorsi a 1100 km all’ora lungo la superficie terrestre, l’onda d’urto generata dall’eruzione del vulcano sottomarino Hunga Tonga – Hunga Ha’Apai ha raggiunto anche l’Italia. I sensori infrasonici del Laboratorio di Geofisica Sperimentale (LGS) del Dipartimento di Scienze della Terra dell’Università di Firenze presenti sul territorio nazionale così come un sensore infrasonico della Lunitek, ubicato a Sarzana, a partire dalle 20:15 locali del 15 gennaio hanno iniziato a registrare le onde d’urto prodotte dall’esplosione del vulcano (ad una distanza tra i 17300 e i 17900 km di distanza dall’eruzione) con direzione media di provenienza di circa 30°N (linee rosse in Figura 2 e 3). Queste prime onde sono passate a nord della Russia vicino al circolo polare artico ed hanno un periodo molto lungo di circa 5 minuti, al limite delle proprietà fisiche delle onde acustiche (linee azzurre in Figura 1 e 2).
figura 2
Dopo circa 19 ore dall’eruzione, sono state registrate le onde (linea azzurra in Figura 1 e 2) che hanno viaggiato lungo una direzione opposta percorrendo una distanza maggiore, ovvero circa 22600, e passando da sud sull’Antartico, con direzione di provenienza 210°S.
La differenza dei tempi di arrivo ha permesso di calcolare che entrambi i fronti d’onda si sono propagati con una velocità di circa 310 m/s (circa 1100 km/h), ovvero la velocità apparente di propagazione del suono in alta atmosfera (Figura 3).
figura 3
Il sensore infrasonico della Lunitek
Gli infrasuoni sono onde sonore a bassa frequenza al di sotto della soglia uditiva (20 Hz) ovvero piccole perturbazioni della pressione atmosferica che, a causa del basso assorbimento atmosferico di tali basse frequenze, possono propagarsi per migliaia di chilometri e possono essere rilevate da sensori di pressione.
Il sensore infrasonico differenziale ideato da GECO e oggetto dell’industrializzazione assieme a Lunitek si basa sulla misura differenziale della pressione e sull’utilizzo di un filtro acustico che permette di eliminare la componente stazionaria della pressione atmosferica. La misura della pressione è affidata a sensori elettronici di categoria industriale, che uniscono all’elevata precisione un alta affidabilità e una costanza nel tempo delle prestazioni.
Oltre alle forti eruzioni come quella del vulcano sottomarino Hunga-Tonga-Ha’apai del 15 Gennaio 2022, molte sono le sorgenti di onde infrasoniche gran parte delle quali prodotte da fenomeni naturali quali le interazioni non lineari tra onde oceaniche aperte (microbaroms, che genera un segnale a ~0.16 Hz rergistrabile su tutta la superficie terrestre in qualsiasi momento), condizioni meteorologiche avverse, degassamento ed esplosioni vulcaniche minori, rapidi flussi di massa come valanghe e frane, terremoti e oscillazioni del suolo connesse, mareggiate, onde di montagna. Efficaci sorgenti antropiche di infrasuono sono invece gli aerei, treni e le perturbazioni generate da forti esplosioni.
Una gamma di sensori con diversa sensibilità e dinamica nonché range di frequenze sono oggetto di industrializzazione da parte di Lunitek, i quali sono in grado di ricoprire i ranges di ampiezza e frequenza di gran parte delle suddette sorgenti infrasoniche consentendone quindi un monitoraggio efficace.
Lo studio dello spettro infrasonico viene spesso effettuato con tecniche di array che permettono di migliorare il rapporto segnale/rumore e di localizzare le sorgenti. In tali tecniche i segnali registrati da sensori posti ad una distanza nota vengono confrontati ed elaborati ed è basilare che la risposta in ampiezza e fase dei sensori sia la stessa. Nel progetto del sensore Lunitek è stata messa una particolare cura al fine di avere prodotti con caratteristiche identiche e quindi immediatamente utilizzabili in array.
In basso è mostrato il segnale infrasonico prodotto dall’eruzione del vulcano Hunga-Tonga-Ha’apai e registrato nei laboratori di Sarzana dal sensore Lunitek M60 ad elevata sensibilità (0.642 V/Pa @1Hz) e medio range di frequenze (0.03 – 200 Hz).
In countries with medium to high seismic risk, a seismic vulnerability assessment is needed. Many infrastructures such as hospitals, schools, bridges or viaducts need urgent and detailed assessments to determine their actual state of preservation.
As recent tragic events have shown, earthquakes and wear and tear are the two of the biggest threats to countries structures and infrastructure and to people’s lives.
What is the ATLANTE Project
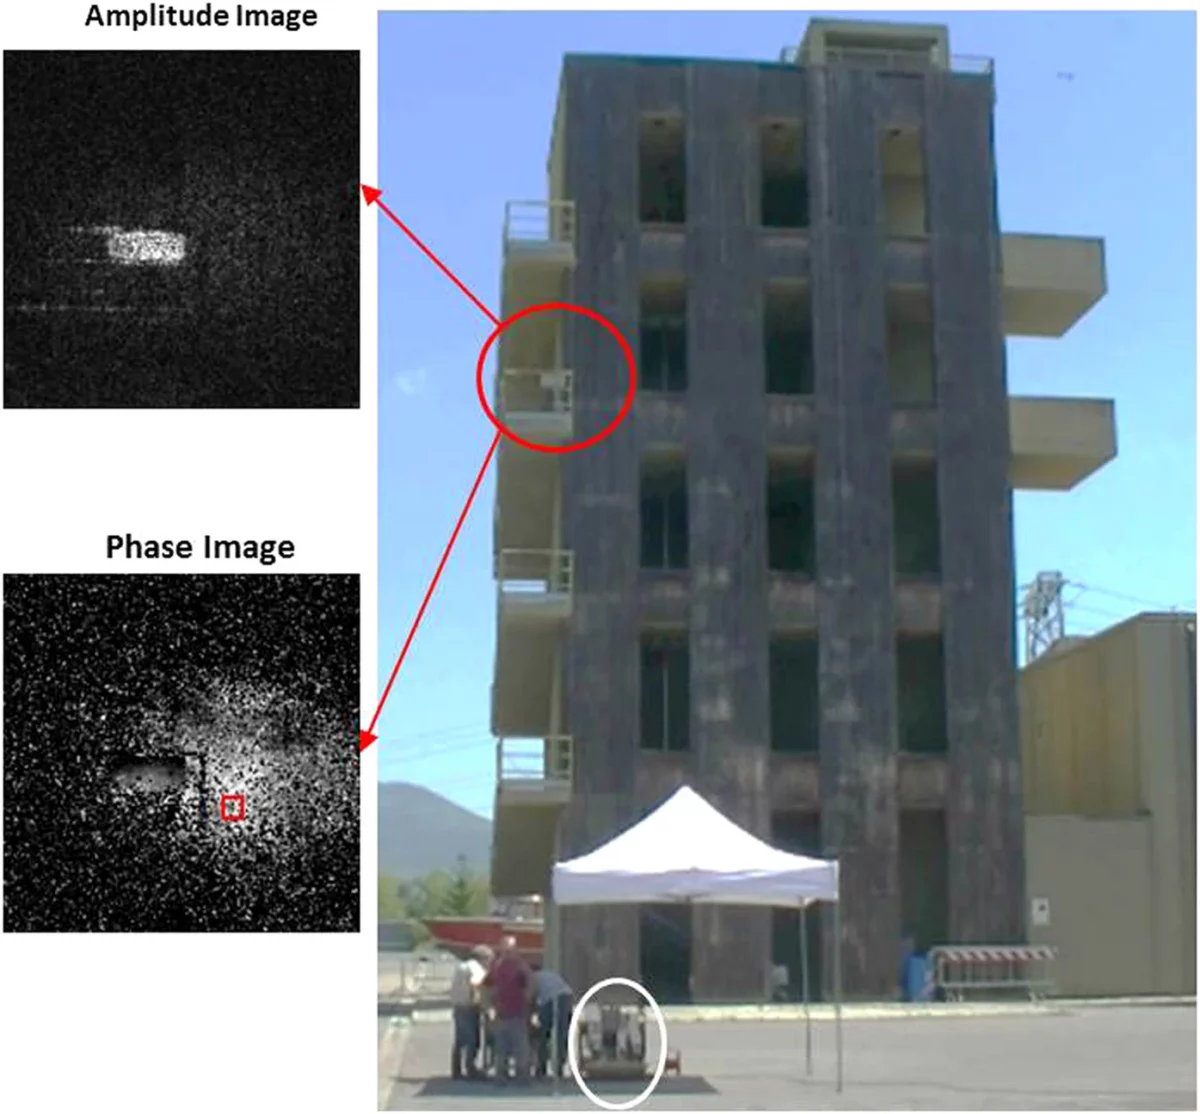
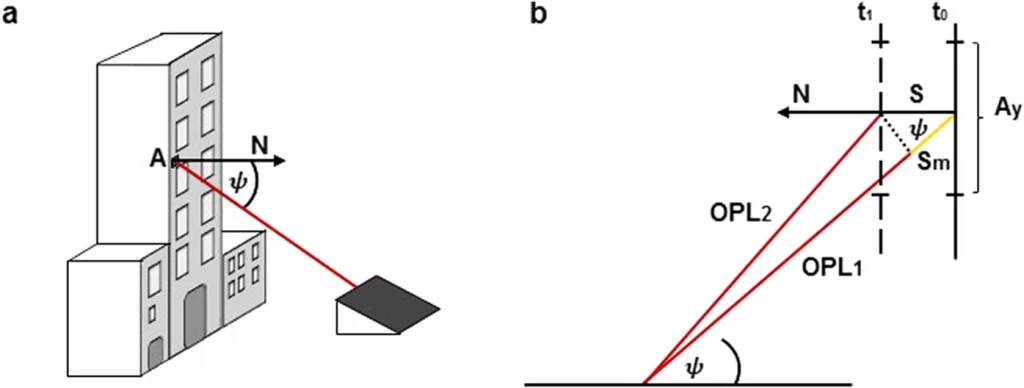
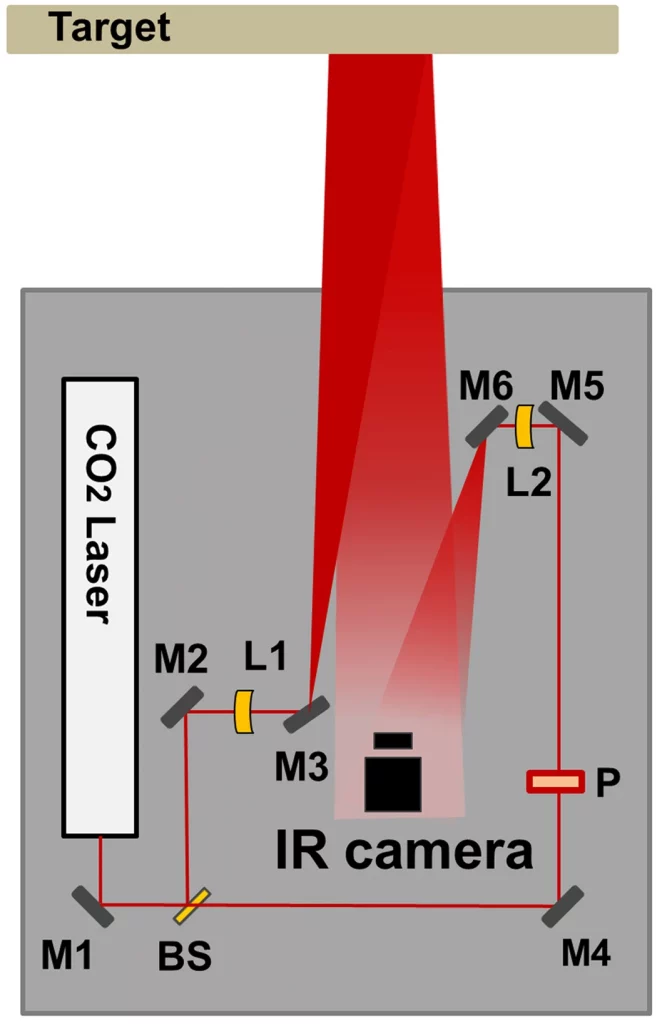
The ATLANTE project of the Tuscany Region concerns the development of an innovative prototype for the monitoring of large structures (buildings, bridges, artifacts, …) that uses the technique of Mid Infrared Digital Holography (MIR DH) and represents real progress in the methods of structural diagnostics. Lunitek is the sole technical/scientific contact for the project, which is supported by Campera Electronic Systems (CES). The technique was developed by the National Institute of Optics of the CNR (CNR-INO) in Florence together with the Department of Earth Science of the University of Florence (UniFI-DST). Prela Perparim LP and DGNET srl are also participating in the project, with Commit Software as consultants.
Comparison between seismic and MIR DH techniques
The limits of the seismic method
Currently, seismic measurements are used to determine the health status of structures and their reference parameters. The seismic technique, based essentially on the use of accelerometers and/or seismometers to be positioned inside the structure, is rather invasive and expensive in terms of time and human resources and it’s therefore difficult to use on a large scale. With this technique, moreover, it’s not possible to obtain information on possible drifts of the structure such as, for example, the slow subsidence of a wall, the buckling of a city wall or the deformation under load of an attic or a bridge. Finally, the seismic technique is not applicable in all those situations where it’s not possible to put the device on the surface to be monitored (vertical surfaces, crumbling structures, architectural elements that are difficult to access, …).
Advantages of the MIR DH technique
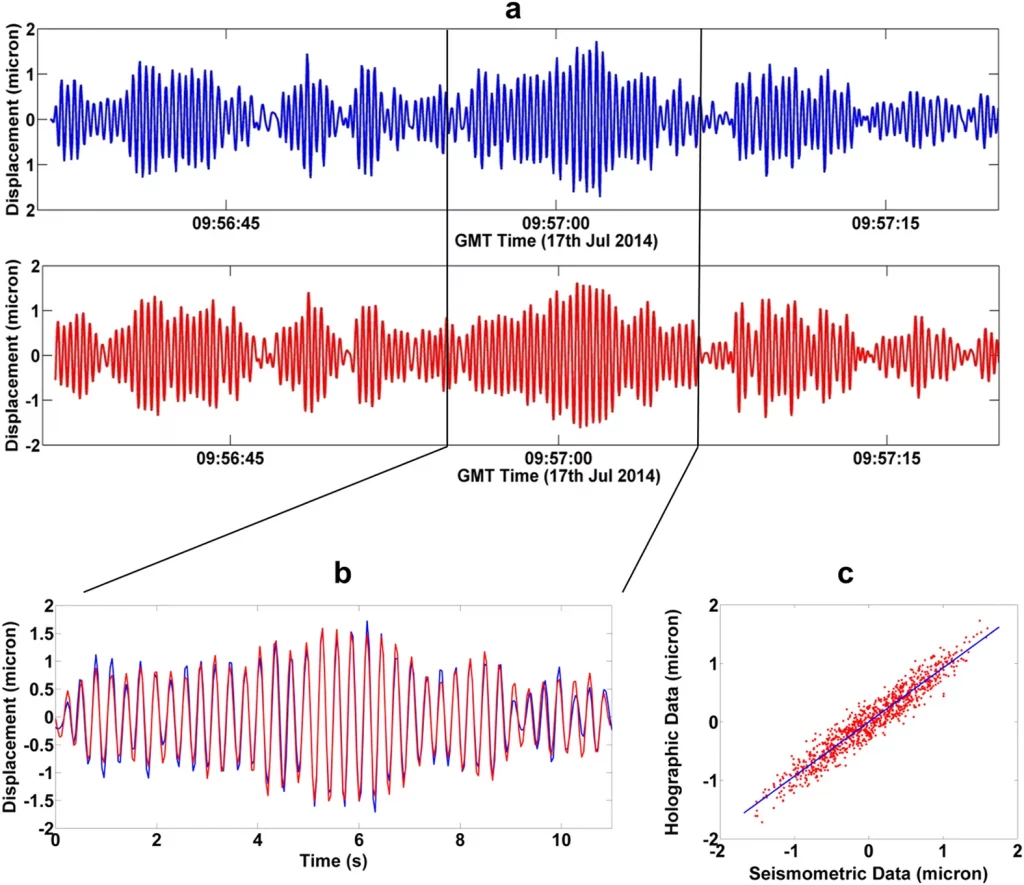
The holographic technique is suitable for monitoring most of the existing structures and allows you to obtain the same information as the seismic technique, in a considerably shorter time, with a more limited use of human resources and remotely, i.e. remaining outside the examined structure, and also allows to monitor all the buildings in an entire urban area.
The holographic technique also allows the user to monitor large surfaces of the structure, obtaining a real map of deformations/displacements of the surface under examination. Finally, unlike the seismic technique, the holographic technique is also able to follow drift motions of the examined structure and to predict the dynamic response of the structure to external stresses, whether environmental or related to human activity.
These features significantly expand the field of application of this technique to structural engineering, seismic vulnerability and cultural heritage conservation, allowing non-invasive monitoring of environmental deterioration and the ageing process of historical monuments and artistic sites.
The technique is mainly indicated in the prevention phase but can also be used in the post-seismic event phase to determine which of the surviving buildings are really safe. The ability to operate remotely and with very short measurement times makes the technique very well suited to large-scale use, allowing the monitoring of entire urban areas.
The technique can also be used for non-destructive tests necessary for the certification of viability of buildings and infrastructures and is perfectly suited to the monitoring of cultural heritage (statues, frescoes, etc.) and, in general, of all those architectural-constructive elements (columns, terraces, chimneys, …) for which it is interesting to provide both static (under load) and dynamic characterization.
It is now generally recognized that the systematic monitoring of most existing buildings and infrastructures is necessary in order to provide the real estate assets with a kind of ‘structural identity card’.
The technique based on MIR DH represents a revolutionary advance in the field of dynamic characterization of large structures to assess their state of health and/or degree of seismic vulnerability and, therefore, establish complete and correct prevention strategies.
The total funding provided by the Tuscany Region amounts to € 587,780.49.
Secondo stime recenti, oltre metà del territorio italiano è classificata a rischio sismico medio-alto; per gli oltre 6 milioni di edifici presenti in questa parte del Paese si renderebbe opportuna una valutazione di vulnerabilità sismica. Sono, invece, oltre 10.000 i ponti o viadotti che necessiterebbero di un’urgente e attenta valutazione al fine di determinarne il reale stato di conservazione.
Come testimoniato anche da recenti tragici avvenimenti, gli eventi sismici e l’usura rappresentano le due principali minacce per le strutture e infrastrutture del nostro Paese e per la vita delle persone.
Che cos’è il Progetto ATLANTE
Il progetto ATLANTE della Regione Toscana riguarda lo sviluppo di un prototipo innovativo per il monitoraggio di grandi strutture (edifici, ponti, manufatti, …) che sfrutta la tecnica dell’Olografia Digitale nell’Infrarosso (Mid Infrared Digital Holography, MIR DH) e che rappresenta un reale progresso nei metodi di diagnostica strutturale. Tale progetto vede Lunitek come Referente tecnico/scientifico unico del progetto che si avvale della consulenza della Campera Electronic Systems (CES). La tecnica è stata messa a punto dall’Istituto Nazionale di Ottica del CNR (CNR-INO) di Firenze insieme al Dipartimento di Scienza della Terra dell’Università di Firenze (UniFI-DST). Partecipano al progetto anche la LP di Prela Perparim e la DGNET srl che si avvale della consulenza della Commit Software.
Tecnica sismometrica e tecnica MIR DH a confronto
I limiti della tecnica sismometrica
Attualmente, per determinare lo stato di salute delle strutture e i relativi parametri di riferimento, si utilizzano misure sismometriche. La tecnica sismometrica, basandosi sostanzialmente sull’utilizzo di accelerometri e/o sismometri da posizionare internamente alla struttura, è piuttosto invasiva e dispendiosa in termini di tempo e di risorse umane ed è pertanto difficilmente impiegabile su larga scala. Con tale tecnica, inoltre, non è possibile ottenere informazioni su eventuali derive della struttura quali potrebbero essere, ad esempio, il cedimento lento di una parete, lo spanciamento di una cinta muraria o la deformazione sotto carico di un solaio o di un ponte. La tecnica sismometrica, infine, non è applicabile in tutte quelle situazioni in cui non sia possibile posizionare il dispositivo sulla superficie che si vuole monitorare (superfici verticali, strutture pericolanti, elementi architettonici difficilmente accessibili, …).
Vantaggi della tecnica MIR DH
La tecnica olografica è adatta al monitoraggio della maggior parte delle strutture esistenti e permette di ottenere le stesse informazioni ricavabili con la tecnica sismometrica, in tempi notevolmente più brevi, con un impiego di risorse umane più limitato e da remoto, rimanendo cioè all’esterno della struttura esaminata e permette, inoltre, di monitorare a tappeto tutti gli edifici di un’intera area urbana.
La tecnica olografica permette, inoltre, di monitorare superfici estese della struttura, ottenendo una vera e propria mappa delle deformazioni/spostamenti della superficie in esame. Infine, a differenza della tecnica sismometrica, la tecnica olografica è in grado di seguire anche moti di deriva della struttura esaminata e permette di prevedere la risposta dinamica della struttura a sollecitazioni esterne, siano esse di natura ambientale o legate all’attività umana.
Queste caratteristiche espandono significativamente il campo di applicazione di tale tecnica all’ingegneria strutturale, alla vulnerabilità sismica e alla conservazione dei beni culturali, consentendo un monitoraggio non invasivo del deterioramento ambientale e del processo di invecchiamento dei monumenti storici e del patrimonio artistico.
La tecnica è indicata principalmente nella fase di prevenzione ma può essere utilizzata anche nelle fasi successive ad un evento sismico per determinare quali degli edifici sopravvissuti siano da considerarsi realmente sicuri. La possibilità di operare da remoto e con tempi di misura molto contenuti rende la tecnica estremamente indicata per un utilizzo su larga scala permettendo il monitoraggio a tappeto di intere aree urbane.
La tecnica può essere anche utilizzata per la realizzazione di test non distruttivi necessari per la certificazione di agibilità di strutture ed infrastrutture edili e si adatta perfettamente al monitoraggio di beni culturali (statue, affreschi, ecc.) e, in generale, di tutti quegli elementi architettonico-costruttivi (colonne, terrazze, camini, ciminiere, …) di cui sia interessante fornire una caratterizzazione sia statica (sotto carico) sia dinamica.
E’ ormai generalmente riconosciuta la necessità di attuare un monitoraggio sistematico di gran parte degli edifici e delle infrastrutture esistenti sul territorio italiano, al fine di dotare l’intero patrimonio immobiliare di una sorta di “carta di identità strutturale”.
La tecnica basata su MIR DH rappresenta un progresso rivoluzionario nel campo della caratterizzazione dinamica delle grandi strutture per valutarne lo stato di salute e/o il grado di vulnerabilità sismica e, quindi, stabilire complete e corrette strategie di prevenzione.
Il totale del finanziamento disposto dalla Regione Toscana è pari a € 587.780,49.
Lunitek has a duty to reduce workplace risk to the lowest feasible level by taking preventative measures. Lunitek has made every reasonable effort to enable working from home as a first option. Where working from home is not possible, we have made every reasonable effort to comply with the social distancing guidelines set out by the government. We fully maintained our operations and activities despite this crisis and we postponed all in-person events and meetings turning, them into virtual events. We have been in close contact with our customers and have provided technical support just as we did before. Lunitek will continue to evaluate and review current practices to ensure staff safety is kept to the highest possible standards and in line with the latest government guidelines.
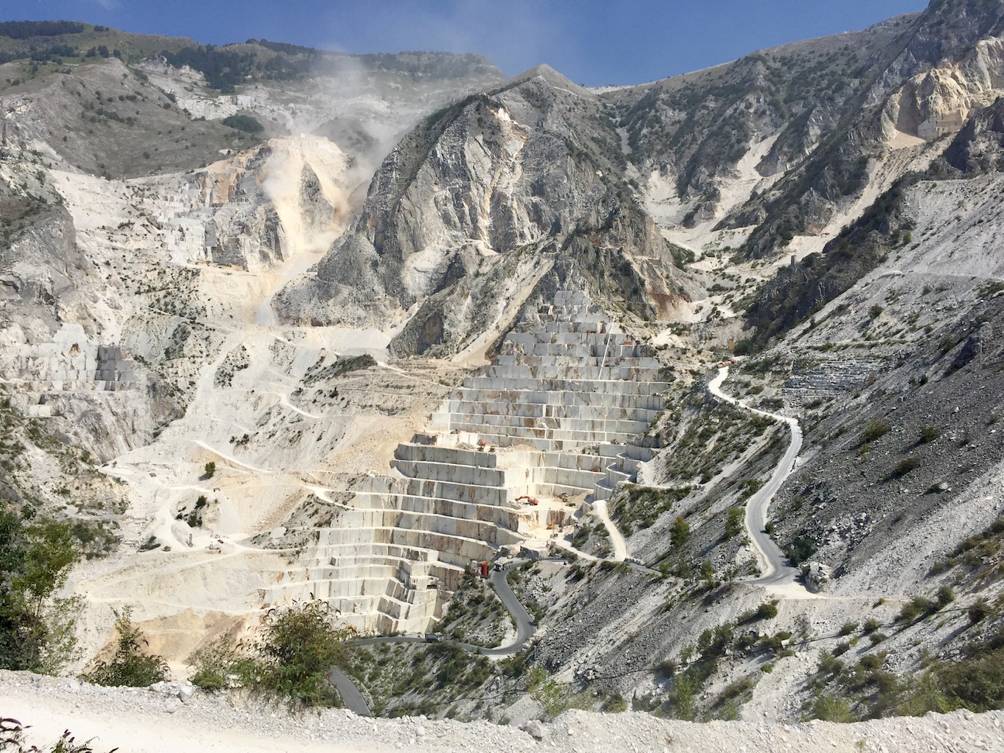
We live near Carrara, the town where the world’s most popular and most sold marble is extracted, Carrara marble. Marble quarries are as impressive and scenic as they are dangerous. Indeed, they are often the place of fatal accidents. This is why the safety of marble quarry workers is a priority for the Tuscany Region.
What is MONFRON?
MONFRON is the acronym of “Monitoraggio Fronte di cava” which translates as “Front of Quarry Monitoring system”.
This is a large project, which was presented to the Tuscany Region in 2017. The project was funded in January 2018 and sees Lunitek as the lead company, together with Santucci Graniti Srl, the quarry owner, and ApiAn the rock climbing organisation.
The project idea is to prevent the sudden and unexpected rockslide falling on quarry workers. Prevention cannot be carried out using traditional instruments for geophysicist (accelerometers, velocimeters, GNSS or laser scanners) because, by the time these types of systems trigger an alert, in most cases, it is already too late, and the rockslide cannot be stopped.
Lunitek presented a proposal for monitoring by employing an Acoustic Emission (AE) technique over a period of 18 months.
How Acoustic Emission technique works?
Acoustic Emission (AE) is the phenomenon of radiating acoustic waves in solids that occurs when a material undergoes irreversible changes in its internal structure. This is due to the rapid release of localized stress energy. Acoustic Emissions can be detected in a frequency range from few KHz up to 100Mhz, but most of the released energy is from 1KHz to 1 MHz.
Thanks to AE technique it is possible to localize the source of the emitting event.
Lunitek has been working in this field in close collaboration with the Polytechnic University of Turin since 2008.
Professors from Structural Department (Carpinteri, Lacidogna, Bertetto, Niccolini) worked with us to transfer their know-how and to design a cutting-edge technology product.
All these efforts have led to the AEmission an 8-channel fast-sampling datalogger with a parametric processing of the acquired data.
AEmission
AEmission is an eight channel datalogger for acoustic emission waves.
It can sample data at 1.25MS/s@18bit or at 10MS/s@16bit.
Piezo-ceramic sensors can be connected directly to the instrument without any external conditioner.
An internal high-performance FPGA performs real-time analysis of the data stream coming from the ADCs and extracts the parametric data.
Why Acoustic Emission is the right tecnique? Acoustic Emission (AE) is the only technology that can spot a potential cracking fractures inside a solid. The idea is to trigger an alert when abnormal conditions are detected on the data processing.
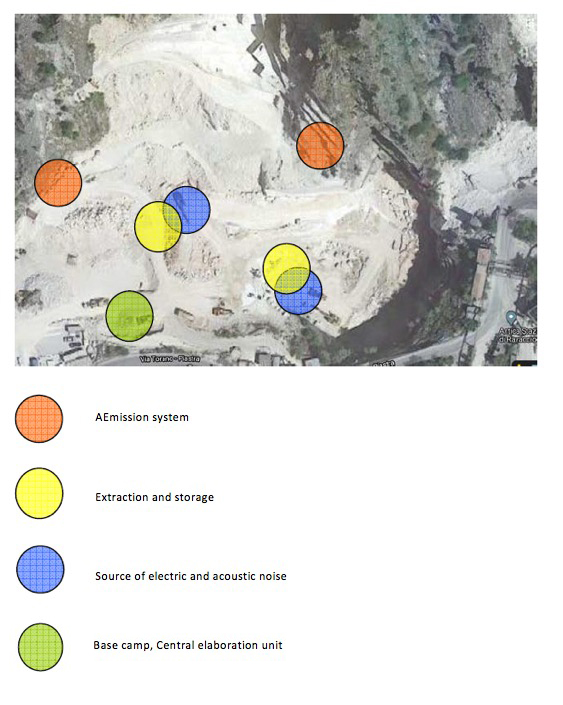
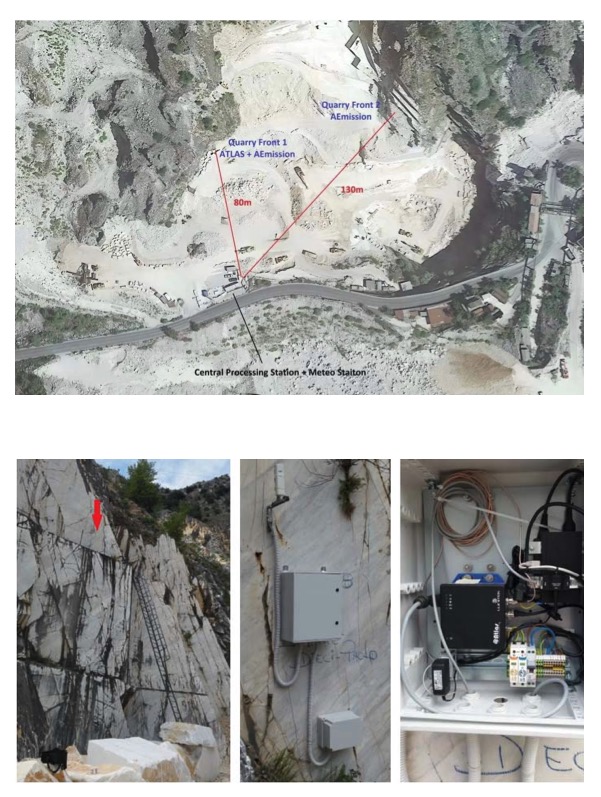
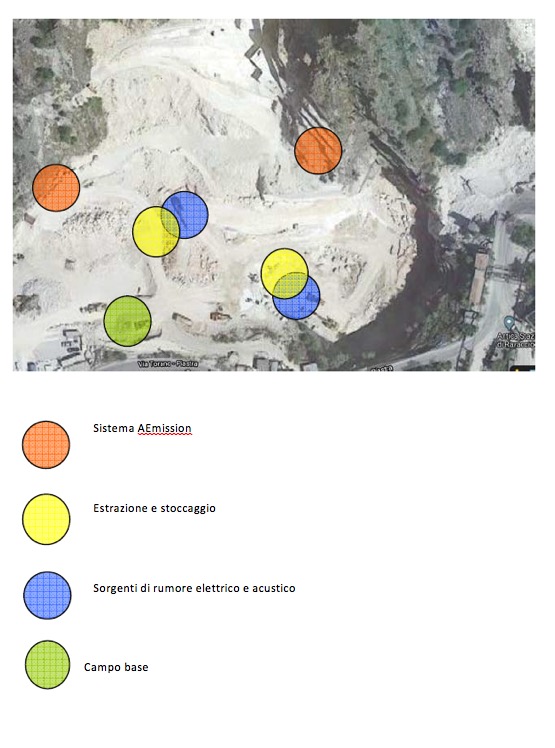
Since we are talking of an experimental investigation, the site is also monitored with other techniques:
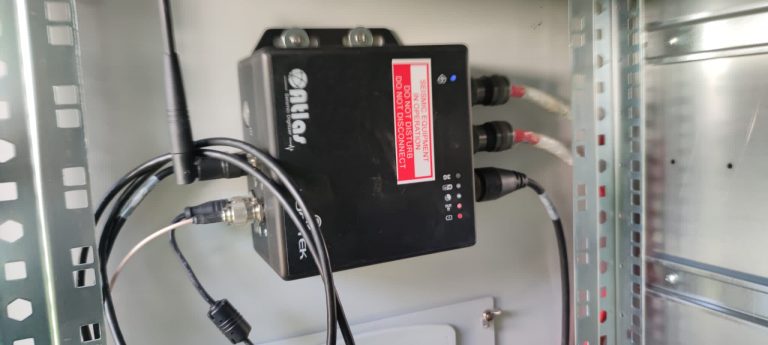
ATLAS with an external FBA accelerometer on the quarry front 1.
TRITON FBA accelerometer outside the monitored site.
A meteorological station.
A thermocouples array installed on the quarry front 2.
All this information can help to discern false events from real cracking events.
The system has been deployed as shown in the below pictures
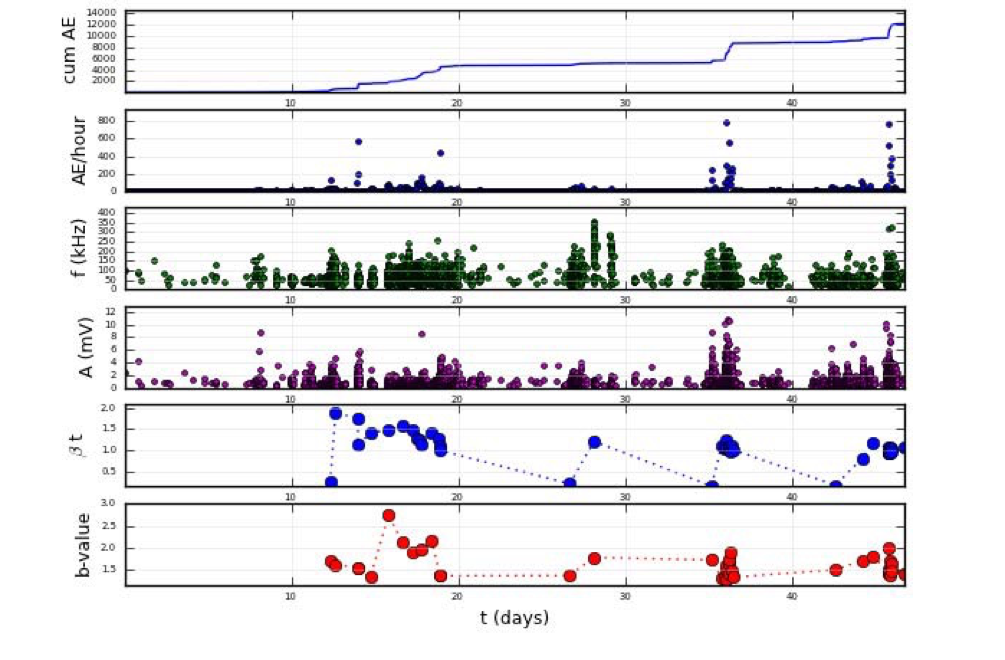
Statistic analysis of B-value and βt parameter
On the below picture some of the monitoring fundamental parameters. In particular it is possible to notice a reduction of the fundamental parameters related to the damage evolution (b-value). It is also possible to notice the appearance of some points of acoustic emission locate on the monitoring front n.2
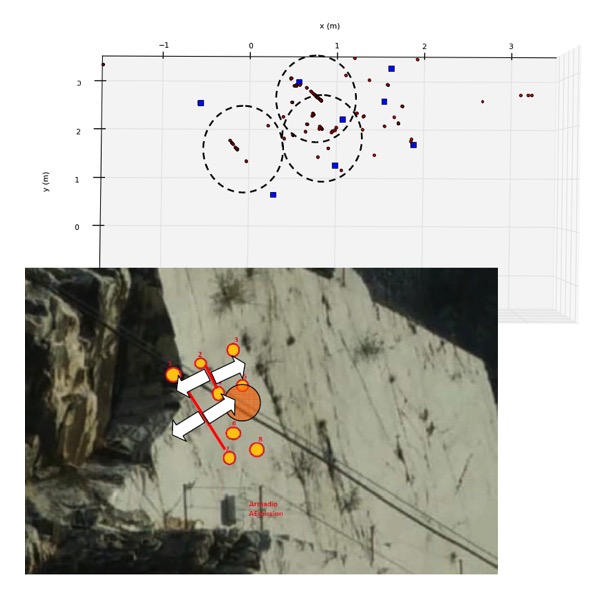
Result and conclusions
Based on the data highlighted by the localization technique and in correlation with the values assumed by the critical parameter of the b-value, it is possible to consider the areas corresponding to sensors 1-7 and 2-4 as critical areas. In these areas, in the central phase of monitoring, the parameters that mark the evolution of the damage highlighted sub-periods with a localized increase of the damage.
The total amount of the founding received from the Tuscany Region was 282.000€
Abitiamo vicino a Carrara, la città dove si estrae il marmo più famoso e venduto al mondo, il marmo di Carrara. Le cave di marmo non sono solo impressionanti e panoramiche ma anche molto pericolose e sono spesso il luogo di incidenti mortali. Per questo motivo la sicurezza dei lavoratori delle cave di marmo è una priorità per la Regione Toscana.
Che cos’è MONFRON?
MONFRON è l’acronimo di “Monitoraggio Fronte di cava”.
Si tratta di un grande progetto, presentato alla Regione Toscana nel 2017. Il progetto è stato finanziato nel gennaio 2018 e vede Lunitek come azienda capofila, insieme alla Santucci Graniti Srl, gestore della cava, e ApiAn la ditta di disgaggiatori.
L’idea progettuale è quella di prevenire la frana improvvisa e inaspettata che, come già capitato in passato, crolla sui lavoratori della cava.
La prevenzione non può essere effettuata utilizzando strumenti tradizionali geofisici (accelerometri, velocimetri, GNSS o scanner laser) perché, nel momento in cui questi tipi di sistemi attivano un allarme, nella maggior parte dei casi è già troppo tardi e la frana non può più essere fermata.
Lunitek ha presentato una proposta per il monitoraggio utilizzando una tecnica di emissione acustica (AE) per un periodo di 18 mesi.
Come funziona la tecnica delle Emissioni Acustiche?
L’emissione acustica (AE) è il fenomeno di irradiazione di onde acustiche nei solidi che si verifica quando un materiale subisce cambiamenti irreversibili nella sua struttura interna. Ciò è dovuto al rapido rilascio di energia da stress localizzato. Le emissioni acustiche possono essere rilevate in una gamma di frequenze da pochi KHz fino a 100 Mhz, ma la maggior parte dell’energia rilasciata va da 1 KHz a 1 MHz.
Grazie alla tecnica AE è possibile localizzare la fonte dell’evento emittente.
Lunitek opera in questo campo in stretta collaborazione con il Politecnico di Torino dal 2008.
I professori del Dipartimento di Ingegneria Strutturale (Carpinteri, Lacidogna, Bertetto, Niccolini) hanno collaborato con noi per trasferire il loro know-how e per progettare un prodotto tecnologico all’avanguardia.
Tutti questi sforzi hanno portato ad AEmission un datalogger a campionamento veloce a 8 canali con elaborazione parametrica dei dati acquisiti.
AEmission
AEmission è un datalogger a otto canali per segnali di emissione acustica. Può campionare dati a 1.25MS/s@18bit oppure 10MS /s@16bit. I sensori possono essere collegati direttamente allo strumento senza alcun condizionatore esterno.
Una FPGA interna ad alte prestazioni esegue l’analisi in tempo reale del flusso di dati proveniente dagli ADC ed estrae i dati parametrici.
L’emissione acustica (AE) è l’unica tecnologia in grado di individuare potenziali fratture da fessurazione all’interno di un solido.
L’idea è quella di attivare un avviso quando vengono valutate anomalie nell’elaborazione dei dati.
Trattandosi di un’indagine sperimentale, il sito viene monitorato anche con altre tecniche:
ATLAS con accelerometro FBA esterno sul fronte della cava 1.
Accelerometro TRITON FBA all’esterno del sito monitorato.
Una stazione meteorologica.
Un array di termocoppie installato sul fronte della cava 2.
Tutte queste informazioni possono aiutare a discernere eventi falsi da eventi di cracking reali.
Il sistema è stato implementato come mostrato nelle immagini sottostanti
Analisi statistica del B-value e del βt
Nelle figure successive i parametri fondamentali del monitoraggio sono stati riportati per i periodi più significativi. In particolare, nella parte finale dei grafici si può osservare una riduzione dei parametri fondamentali connessi all’evoluzione del danneggiamento (b-value) con un decremento. Nell’ambito di tali osservazioni si è potuto osservare anche la formazione di punti di sorgenti localizzati sul sito di monitoraggio n2.
Risultati e conclusioni
In ragione dei dati evidenziati dalla tecnica di localizzazione e in correlazione con i valori assunti dal parametro critico del b-value è possibile considerare le aree in corrispondenza dei sensori 1-7 e 2-4 come aree critiche. In tali aree, nella fase centrale del monitoraggio anche i parametri che tengono in conto dell’evoluzione del danneggiamento hanno evidenziato dei sotto periodi con aumento localizzato del danneggiamento.
Il totale del finanziamento disposto dalla Regione Toscana è pari a 282.000€
We use cookies on our website to give you the most relevant experience by remembering your preferences and repeat visits. By clicking “Accept All”, you consent to the use of ALL the cookies. However, you may visit "Cookie Settings" to provide a controlled consent.
This website uses cookies to improve your experience while you navigate through the website. Out of these, the cookies that are categorized as necessary are stored on your browser as they are essential for the working of basic functionalities of the website. We also use third-party cookies that help us analyze and understand how you use this website. These cookies will be stored in your browser only with your consent. You also have the option to opt-out of these cookies. But opting out of some of these cookies may affect your browsing experience.
Necessary cookies are absolutely essential for the website to function properly. These cookies ensure basic functionalities and security features of the website, anonymously.
Cookie
Duration
Description
cookielawinfo-checkbox-advertisement
1 year
Set by the GDPR Cookie Consent plugin, this cookie is used to record the user consent for the cookies in the "Advertisement" category .
cookielawinfo-checkbox-analytics
11 months
This cookie is set by GDPR Cookie Consent plugin. The cookie is used to store the user consent for the cookies in the category "Analytics".
cookielawinfo-checkbox-functional
11 months
The cookie is set by GDPR cookie consent to record the user consent for the cookies in the category "Functional".
cookielawinfo-checkbox-necessary
11 months
This cookie is set by GDPR Cookie Consent plugin. The cookies is used to store the user consent for the cookies in the category "Necessary".
cookielawinfo-checkbox-others
11 months
This cookie is set by GDPR Cookie Consent plugin. The cookie is used to store the user consent for the cookies in the category "Other.
cookielawinfo-checkbox-performance
11 months
This cookie is set by GDPR Cookie Consent plugin. The cookie is used to store the user consent for the cookies in the category "Performance".
CookieLawInfoConsent
1 year
Records the default button state of the corresponding category & the status of CCPA. It works only in coordination with the primary cookie.
viewed_cookie_policy
11 months
The cookie is set by the GDPR Cookie Consent plugin and is used to store whether or not user has consented to the use of cookies. It does not store any personal data.
Functional cookies help to perform certain functionalities like sharing the content of the website on social media platforms, collect feedbacks, and other third-party features.
Performance cookies are used to understand and analyze the key performance indexes of the website which helps in delivering a better user experience for the visitors.
Analytical cookies are used to understand how visitors interact with the website. These cookies help provide information on metrics the number of visitors, bounce rate, traffic source, etc.
Cookie
Duration
Description
CONSENT
2 years
YouTube sets this cookie via embedded youtube-videos and registers anonymous statistical data.
_ga
2 years
The _ga cookie, installed by Google Analytics, calculates visitor, session and campaign data and also keeps track of site usage for the site's analytics report. The cookie stores information anonymously and assigns a randomly generated number to recognize unique visitors.
_gat_gtag_UA_168680146_1
1 minute
Set by Google to distinguish users.
_gcl_au
3 months
Provided by Google Tag Manager to experiment advertisement efficiency of websites using their services.
_gid
1 day
Installed by Google Analytics, _gid cookie stores information on how visitors use a website, while also creating an analytics report of the website's performance. Some of the data that are collected include the number of visitors, their source, and the pages they visit anonymously.
Advertisement cookies are used to provide visitors with relevant ads and marketing campaigns. These cookies track visitors across websites and collect information to provide customized ads.
Cookie
Duration
Description
NID
6 months
NID cookie, set by Google, is used for advertising purposes; to limit the number of times the user sees an ad, to mute unwanted ads, and to measure the effectiveness of ads.
test_cookie
15 minutes
The test_cookie is set by doubleclick.net and is used to determine if the user's browser supports cookies.
VISITOR_INFO1_LIVE
5 months 27 days
A cookie set by YouTube to measure bandwidth that determines whether the user gets the new or old player interface.
YSC
session
YSC cookie is set by Youtube and is used to track the views of embedded videos on Youtube pages.
yt-remote-connected-devices
never
YouTube sets this cookie to store the video preferences of the user using embedded YouTube video.
yt-remote-device-id
never
YouTube sets this cookie to store the video preferences of the user using embedded YouTube video.
 Skip to the content